The market delivered a topsy-turvy performance to close the week of trading on April 1, 2016. First and foremost, the S&P 500 (SPY) notably diverged from the price of oil. While the S&P 500 initially dipped to start the day’s trading (presumably in response to a strong jobs report which – gasp – means a strong economy and a slightly higher expectation for interest rates), the index rallied through the rest of the day. United States Oil (USO) gapped down and never mustered even a hint of a rally. The presumed cause of the latest oil angst was a story that the Saudis will only freeze output if Iran promises to do so…from what I understand, Iran is not interested.

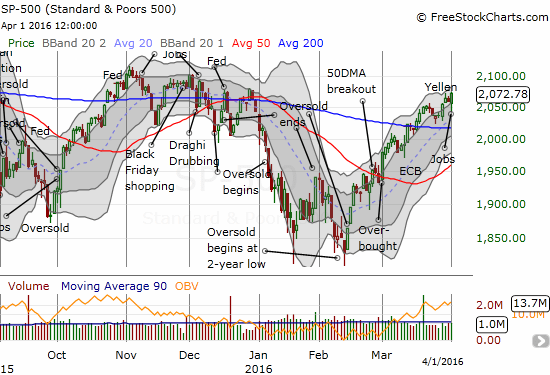
The S&P 500 starts off April with an impressive recovery from intraday lows and a new closing 3-month high.

United States Oil (USO) tumbles into critical support at its 50-day moving average (DMA)
Friday’s wide divergence represents the exclamation mark for a parting of ways that has slowly built since USO’s last peak on March 18th. While oil consistently declined from that point, the S&P 500 hesitated with a very shallow decline that lasted just three days. A decoupling from oil is supposedly bullish given it suggests the market is no longer panicking about a financial contagion from collapsing companies in the oil patch. Hopefully now consumers can focus more on the benefits of paying lower prices for oil.
Anyway, the bullish combination of a resilient T2108 (the % of stocks trading above their respective 40DMAs) and an on-going rise in T2107 (the % of stocks trading above their respective 200DMAs) continues. T2108 has not only been overbought for 23 days but also my favorite technical indicator has traded above 80% for 21 of those days. This extended and stubborn bullishness puts the market right on the edge of take-off. The chart below shows that the overall performance for the S&P 500 for longer durations starts to increase nearly linearly.


Leave A Comment