
The good news is:
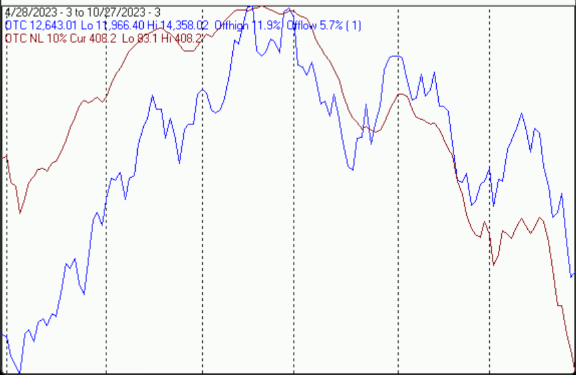
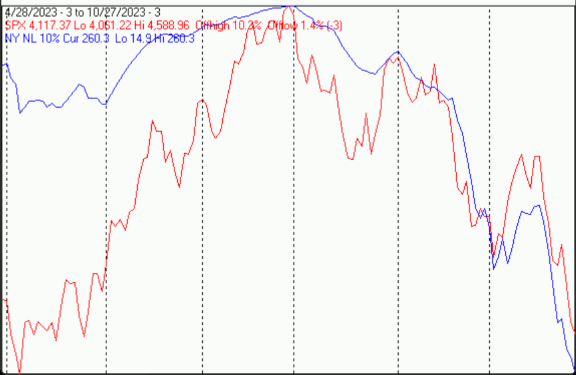
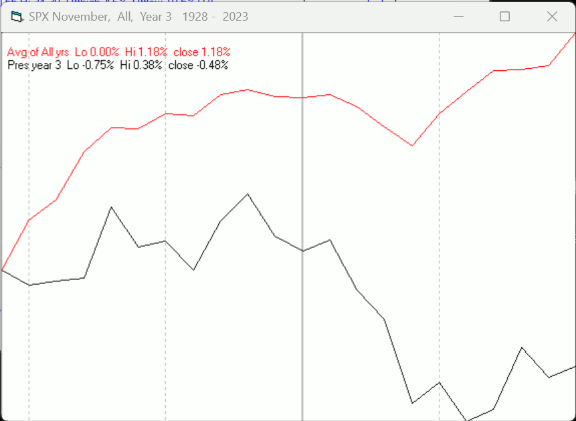
The NegativesThe first chart covers the last 6 months showing the S&P 500 (SPX) in red and a 10% trend (19 day EMA) of NYSE new highs (NY NH) in green. Dashed vertical lines have been drawn on the 1st trading day of each month.NY NH fell to another 6 month low.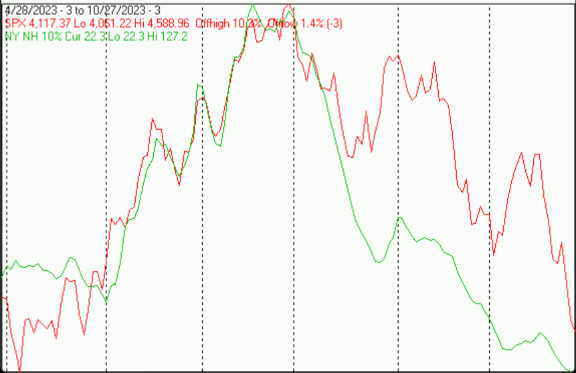
Report for the last 2 days of October and first 3 days of November.
The number following the year represents its position in the Presidential Cycle.
The number following the daily return represents the day of the week;
1 = Monday, 2 = Tuesday etc.
OTC Presidential Year 3 (PY3)
Day2 Day1 Day1 Day2 Day3 Totals
1963-3 -0.64% 3 -0.81% 4 0.14% 5 0.06% 1 -0.93% 3 -2.19%
1967-3 -0.24% 1 0.02% 2 -0.63% 3 -1.05% 4 -0.50% 5 -2.40%
1971-3 0.21% 4 0.57% 5 -1.34% 1 -0.14% 2 1.42% 3 0.72%
1975-3 -0.17% 4 -0.59% 5 -0.48% 1 0.31% 2 0.57% 3 -0.36%
1979-3 1.17% 2 0.04% 3 0.66% 4 0.34% 5 -0.56% 1 1.64%
Avg 0.07% -0.15% -0.33% -0.10% 0.00% -0.52%
1983-3 -0.49% 5 -0.58% 1 -0.55% 2 0.78% 3 -0.12% 4 -0.95%
1987-3 2.00% 4 2.00% 5 1.56% 1 -2.00% 2 -0.17% 3 3.39%
1991-3 1.27% 3 0.31% 4 -0.38% 5 -0.63% 1 0.25% 2 0.81%
1995-3 1.37% 1 -0.35% 2 0.42% 3 1.61% 4 0.79% 5 3.86%
1999-3 2.00% 4 2.00% 5 0.04% 1 0.47% 2 1.58% 3 6.09%
Avg 1.23% 0.68% 0.22% 0.05% 0.47% 2.64%
2003-3 -0.20% 4 -0.02% 5 1.84% 1 -0.49% 2 0.07% 3 1.19%
2007-3 -0.03% 2 1.51% 3 -2.00% 4 0.56% 5 -0.54% 1 -0.50%
2011-3 -0.05% 5 -1.93% 1 -2.00% 2 1.27% 3 2.00% 4 -0.71%
2015-3 -0.42% 4 -0.40% 5 1.45% 1 0.35% 2 -0.05% 3 0.93%
2019-3 0.33% 3 -0.14% 4 1.13% 5 0.56% 1 0.02% 2 1.90%
Avg -0.07% -0.20% 0.08% 0.45% 0.30% 0.56%
OTC summary for PY3 1963 – 2019
Averages 0.41% 0.11% -0.01% 0.13% 0.26% 0.89%
% Winners 47% 47% 53% 67% 53% 60%
MDD 11/1/2011 3.94% — 11/3/1967 2.38% — 11/6/1963 2.17%
OTC summary for all years 1963 – 2022
Averages 0.27% 0.25% 0.24% 0.15% 0.27% 1.19%
% Winners 57% 63% 65% 53% 65% 75%
MDD 11/3/2022 5.53% — 11/5/1973 4.43% — 11/1/2011 3.94%
SPX PY3
Day2 Day1 Day1 Day2 Day3 Totals
1931-3 2.00% 5 0.96% 6 -0.28% 1 2.00% 3 -0.37% 4 4.30%
1935-3 -0.72% 3 0.81% 4 1.20% 5 -0.24% 6 0.32% 1 1.37%
1939-3 -0.15% 1 -1.00% 2 -0.08% 3 0.16% 4 0.86% 5 -0.22%
1943-3 -0.42% 5 0.08% 6 0.00% 1 -1.17% 3 -0.85% 4 -2.36%
1947-3 -1.03% 4 0.65% 5 0.32% 6 -0.13% 1 -0.78% 3 -0.96%
1951-3 -0.13% 2 1.24% 3 0.70% 4 -0.74% 5 -0.83% 6 0.24%
1955-3 0.55% 5 -0.07% 1 -0.14% 2 0.17% 3 2.00% 4 2.50%
1959-3 -0.09% 4 0.19% 5 -0.19% 1 -0.26% 3 0.10% 4 -0.24%
Avg -0.22% 0.42% 0.14% -0.43% -0.07% -0.17%
1963-3 -0.89% 3 0.28% 4 -0.24% 5 -0.51% 1 -0.87% 3 -2.23%
1967-3 -0.18% 1 -0.94% 2 -1.27% 3 -0.40% 4 -0.61% 5 -3.39%
1971-3 0.18% 4 0.29% 5 -1.52% 1 0.41% 2 1.86% 3 1.22%
1975-3 -0.09% 4 -0.30% 5 -1.07% 1 0.48% 2 0.72% 3 -0.26%
1979-3 1.95% 2 -0.83% 3 0.74% 4 -0.06% 5 -0.67% 1 1.12%
Avg 0.19% -0.30% -0.67% -0.02% 0.09% -0.71%
1983-3 -0.89% 5 0.11% 1 0.06% 2 0.73% 3 -0.84% 4 -0.84%
1987-3 2.00% 4 2.00% 5 1.57% 1 -1.93% 2 -0.74% 3 2.90%
1991-3 0.38% 3 -0.13% 4 -0.29% 5 -0.27% 1 -0.40% 2 -0.71%
1995-3 0.61% 1 -0.30% 2 0.47% 3 0.94% 4 0.14% 5 1.87%
1999-3 2.00% 4 1.53% 5 -0.65% 1 -0.47% 2 0.53% 3 2.94%
Avg 0.82% 0.64% 0.23% -0.20% -0.26% 1.23%
2003-3 -0.11% 4 0.36% 5 0.79% 1 -0.54% 2 -0.14% 3 0.36%
2007-3 -0.65% 2 1.20% 3 -2.00% 4 0.08% 5 -0.50% 1 -1.86%
2011-3 0.04% 5 -2.00% 1 -2.00% 2 1.61% 3 1.88% 4 -0.47%
2015-3 -0.04% 4 -0.48% 5 1.19% 1 0.27% 2 -0.35% 3 0.58%
2019-3 0.33% 3 -0.30% 4 0.97% 5 0.37% 1 -0.12% 2 1.24%
Avg -0.09% -0.24% -0.21% 0.36% 0.15% -0.03%
SPX summary for PY3 1931 – 2019
Averages 0.20% 0.15% -0.08% 0.02% 0.02% 0.31%
% Winners 43% 57% 43% 48% 39% 52%
MDD 11/1/2011 3.96% — 11/3/1967 3.35% — 11/4/1987 2.65%
SPX summary for all years 1928 – 2022
Averages 0.25% 0.14% 0.27% 0.10% 0.25% 1.00%
% Winners 58% 56% 63% 57% 65% 72%
MDD 11/3/1932 6.30% — 11/5/1973 5.07% — 11/4/1937 4.46% NovemberSince 1963, over all years, the OTC in November has been up 73% of the time with an average gain of 1.8%. During the 3rd year of the Presidential Cycle November has been up 60% time with an average gain of 1.0%. The best November for the OTC was 2001 (+14.2%), the worst 2000 (-22.9%).The average month has 21 trading days. The chart below has been calculated by averaging the daily percentage change of the OTC for each of the 1st 11 trading days and each of the last 10. In months when there were more than 21 trading days some of the days in the middle were not counted. In months when there were less than 21 trading days some of the days in the middle of the month were counted twice. Dashed vertical lines have been drawn after the 1st trading day and at 5 trading day intervals after that. The line is solid on the 11th trading day, the dividing point.In the chart below, the blue line shows the average of the OTC in November over all years since 1963 while the black line shows the average during the 3rd year of the Presidential Cycle over the same period.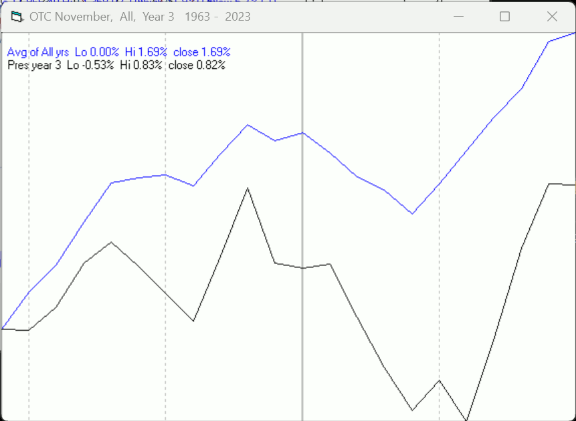
ConclusionEverything is at oversold extremes. A relief rally might be helped by modestly positive Seasonality.The strongest sectors last week were Precious Metals (for the 2nd week) and Utilities while the weakest were (same as last week) Electronics and Transportation.I expect the major averages to be lower on Friday November 2 than they were on Friday October 27. More By This Author:Technical Market Report For October 14, 2023 Technical Market Report For Oct. 14, 2023 Technical market report for October 7, 2023


Leave A Comment