

In this past weekend’s newsletter, I reviewed every S&P sector and several major markets to analyze the risk/reward opportunities that currently exist. In a nutshell, there really weren’t many. To wit:
“We can also witness the rather extreme extension of prices above the 200-dma. Such extensions, which are always combined with extreme overbought conditions, have typically not lasted long and have been a good indication to take profits in the short-term. This provides some opportunity to invest capital following a correction to some level of support.”

On Monday, the market reversed much of the advance from last week as a spike in volatility pressured stocks lower. Importantly, one of the bigger concerns, from a short-term risk assessment view, has been the negative divergence of the MACD (moving average convergence divergence) with the potential of a short-term sell signal. The combination of these suggests a larger corrective action may be in store.

BUY THE DIP?
Which brings us today’s questions. How big of a correction might we expect and should it be bought?
For the answer to the first question, we can review recent support levels and make some educated guesses. The first chart below shows the standard Fibonacci retracement levels for the S&P 500 from the previous lows. Initially, the market should find support at the retest of the bullish trend line from the February 2016 lows. A failure there will be a retracement of 38.2% of the recent advance to roughly 2300.
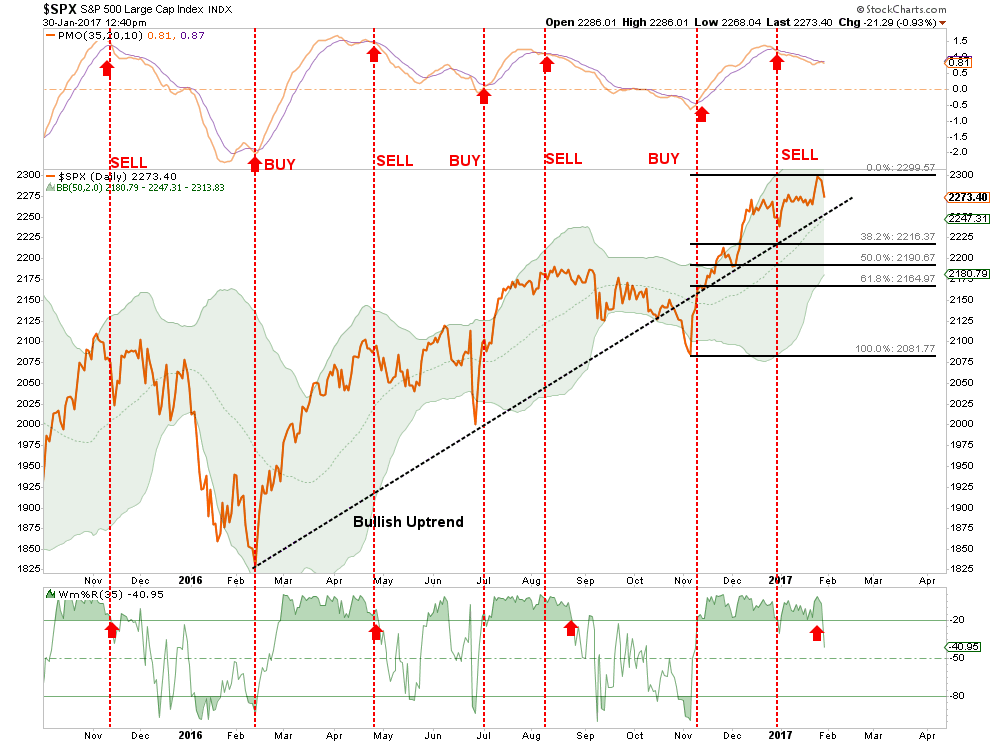
Importantly, I have noted with vertical dashed red lines the buy and sell indications relative to the markets subsequent direction. In each case, a registered sell signal at the top of the chart, and confirmed by a reversal of the bottom indicator, have led to short and intermediate-term corrections in the market. These two signals should not be ignored.
The next chart attempts to quantify several potential correction levels from the recent highs.
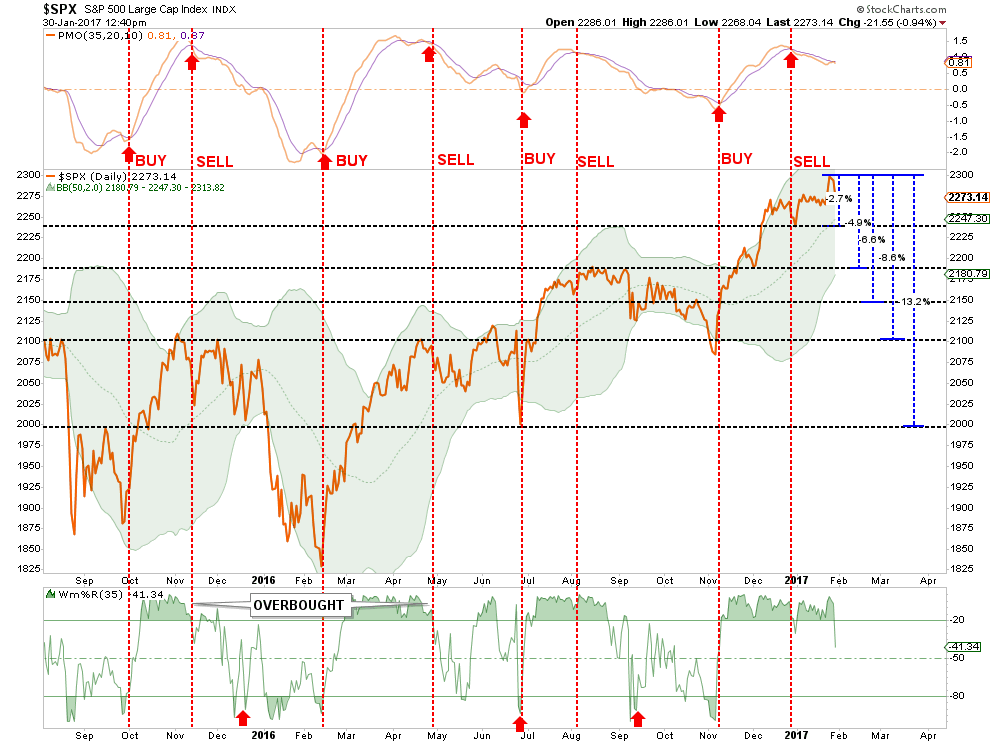
In this analysis, the correction could be as small as 2.7% or potentially as large at 13.2%. This is quite a dispersion of outcomes and one we will only know with certainty after the fact. However, recent history has suggested that similar setups have seen deeper corrections so such risk should not be readily dismissed.


Leave A Comment