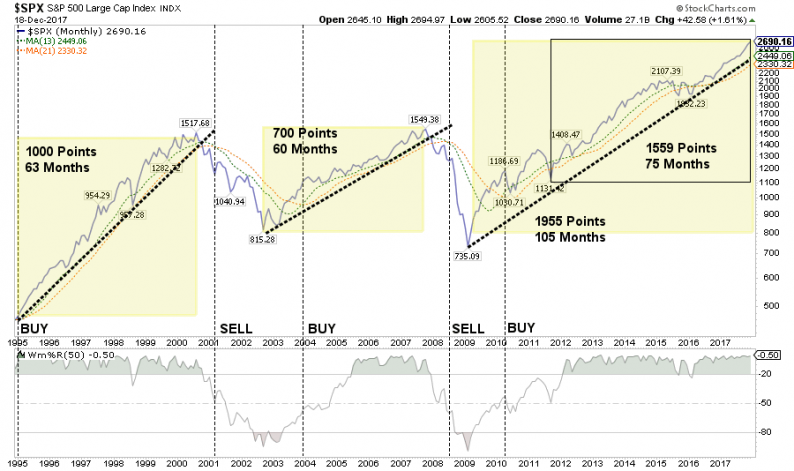
In last week’s Technical Update, I discussed the similarities between 1999, 2007 and currently. To wit:
“With the markets within striking distance of Nasdaq 7000, Dow 25000 and S&P 2700, all three levels are all but guaranteed at this juncture. More interestingly, all three will be ticking off milestone gains at some of the fastest paces in market history. In fact, the Dow has posted three all-time records just this year:
- 70 new highs,
- A 5000-point advance in a single year, and;
- 12-straight months of gains.
Just as a reminder of previous market bubbles, here is what they looked like.”

Since this is the last “Technically Speaking” post of 2017, I wanted to take a look back at the year in review of the major markets and sectors.
Sector By Sector
ENERGY
After having been out of the energy sector entirely since early 2014, we recently added some exposure back to the sector a couple of week’s ago as noted in the weekly newsletter:
“As I noted previously, the energy sector had gotten trapped between the 50 and 200-dma. The positive backdrop, however, was the 50-dma having crossed above the 200-dma. I have noted over the last couple of weeks we were looking for a tactical trading entry point. We achieved that this week with the bounce of the 50-dma. We are adding one-half of a tactical trading position to portfolios next week.”
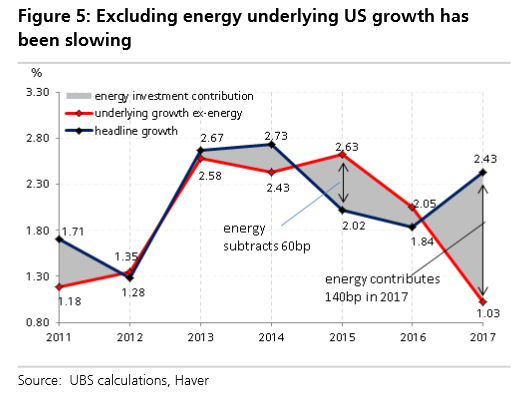
Looking back over the past year, the recovery in oil prices has led to a lift in not only the energy sector but, as noted previously, is responsible for the majority of the economic lift in 2017. To wit:
“Taken at face value, the chart suggests underlying US growth has been slowing dramatically, from about 2.6% in 2015 to only around 1% in 2017. We do not quite interpret it that way, and view it more as a story of stability and ‘adding-up constraints’. The economy can only produce so much, and when one sector is strong (energy), it absorbs labor disproportionately, while other sectors pull back. Furthermore, when investment is weak the consumer accelerates. US growth post-crisis has hovered around a 2% average and nothing in our recession probability models suggests that there is anything ominous going on. But the point of Figure 5 is to show that as energy investment runs out of steam, other sectors will need to accelerate significantly to maintain the current pace of growth.”
Furthermore, the 100% surge in energy prices from $30 back to near $60/bbl has provided a huge tailwind to earnings in the S&P 500. As noted previously:
While we did add an energy “trade” recently, it is nothing more than that at the moment. Currently, the energy sector remains in a negative trend but has now reached extremely overbought levels along with oil prices. As shown below, with oil prices and energy-related indices trading at 3-standard deviations above longer-term means, a correction in the new year is quite likely. With $45/bbl now important support, it will be worth watching forward developments very closely.


Leave A Comment