
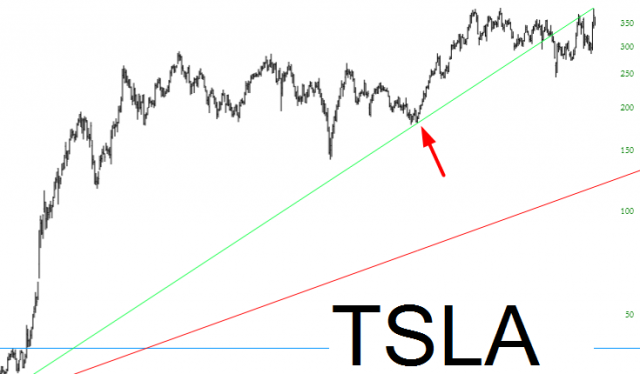
With all the madness circling Tesla these days, I thought we’d take a look at the chart of the company’s stock. In particular, take note of that green trendline, which had been inviolate for years. It was challenged at times (see arrow), but it was only recent broken to the downside.
Looking closer, you can see the failure point (circle) and the two times it was challenged as support, instead of its former role of resistance (arrows). What I find fascinating is that, in spite of an earth-shaking tweet from Musk about a $420 buyout offer, the trendline was more powerful than the price. It didn’t get even CLOSE to $420. Instead, it got to about $380 and then, BOING, down it went.

It’ll be fascinating, of course, to see if anything actually comes to pass with this LBO. I’m staying far away from TSLA.


Leave A Comment