
Demand for safe-haven Treasuries kicked into high gear yesterday, which cut the benchmark 10-year Treasury yield down to its lowest level in nearly ten months. What’s driving this key rate down? A combination of factors, ranging from renewed market jitters over the latest missile test by North Korea to concerns that Hurricane Harvey will take a toll on US economic growth to a weak run of inflation in 2017.
A new survey of economists advises that the storm will reduce GDP growth in the third quarter by 0.2 percentage point, according to the median projection. “Rebuilding would then give growth a bump in the fourth quarter by the same amount, they estimated,” Bloomberg reports. “A broader survey prior to the storm estimated a growth pace of 2.5 percent for the third quarter and 2.4 percent from October through December.” The main takeaway: GDP growth in the near future is expected to remain just below the 2.6% pace in Q2.
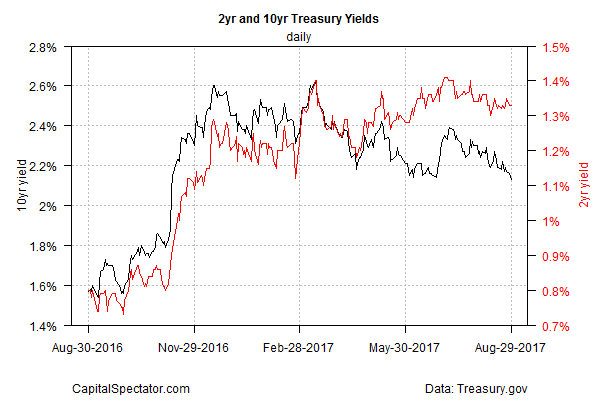
At one point yesterday the 10-year rate fell below 2.10% before rebounding intraday to end the session at roughly 2.13% on Wednesday (Aug. 29), based on daily data via Treasury.gov. Nonetheless, the downside bias in the benchmark rate remains intact. The jump in the 10-year yield that followed Donald Trump’s election last November — a rise triggered by expectations that economic growth would accelerate under the new administration — is just a few basis points away from completely reversing.
Another factor that’s weighing on the 10-year rate: low inflation. As I discussed last week, the personal consumption expenditures price indexes for the headline and core (ex-energy and food) measures, which the Fed monitors closely, have been running below the central bank’s 2.0% in recent months. The weakness suggests that the economy’s too soft to sustain more interest rate hikes. Soft inflation may also be a sign that the macro trend is weakening.
As for the directional outlook for rates, one way to assess the 10-year yield is with a set of exponential moving averages (EMAs), which are more sensitive to recent data compared with simple moving averages (SMAs). The chart below shows that several EMAs may be set to roll over and signal an extended downward move in the benchmark rate. In fact, the same set of SMAs already point to a renewed downward bias for the 10-year yield. The forecast will strengthen if the EMAs confirm the outlook in the coming days.


Leave A Comment