I see just about everyone has their own theory or trading discipline on where the US dollar is headed next. It’s all these different ideas that make the markets work. Everyone can’t be bullish at the bottom or bearish at the top, it’s just the way it has to be.
For my 2 cents worth I’m still looking at the possible fractal, bullish rising wedge as a halfway pattern to the upside. I did an in depth report on currencies and the US dollar several months ago in which I showed how it could play out. Since that report the US dollar has declined down to the point, where if the fractal is going to work, now is the time for the US dollar to put in its bottom.
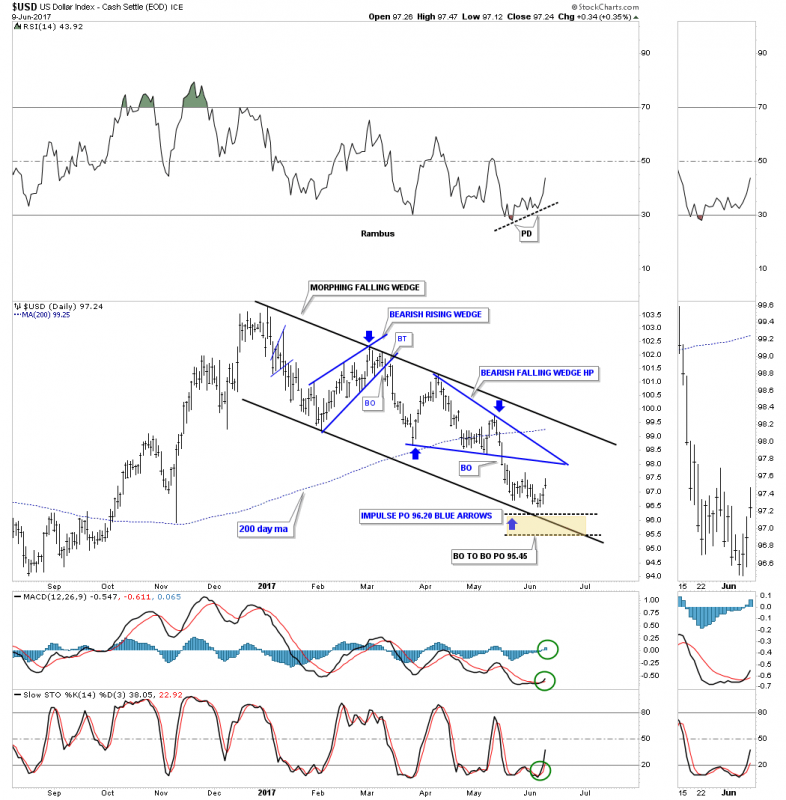
If you recall earlier this year the US dollar began building out a falling wedge while gold was building out a rising wedge. At the time I thought the US dollar would breakout topside and gold would breakout to the downside, but the markets never make it easy for you. A month or so ago when it became apparent that the US dollar was breaking down, I posted this daily chart looking for a measured move down to the 96.20 using the impulse method as shown by the blue arrows. The breakout to breakout method was a little lower at 95.45. So far the US dollar has reached a low of 96.45 were it has been chopping sideways for the last 2 weeks. If this is going to be an important low then we will most likely see some type of reversal pattern building out such as a double bottom or H&S bottom. So far we don’t have a recognizable reversal pattern in place. All the indicators are suggesting a potential low in here, but I want to see a reversal pattern before I get too excited.

It was this 35 year monthly chart for the US dollar which led to to the discovery of the 2 fractal bases labeled big base #1 and big base #2 back in March 2013.

Editor’s Note: If you are interested here is the Whole Post from March 2013 ” Dollar Bears Prepare to Hibernate”
…………………………………………..


Leave A Comment