Well, after a wretched day like Tuesday, it’s nice to still look at an example of technical analysis not just working, but working beautifully.
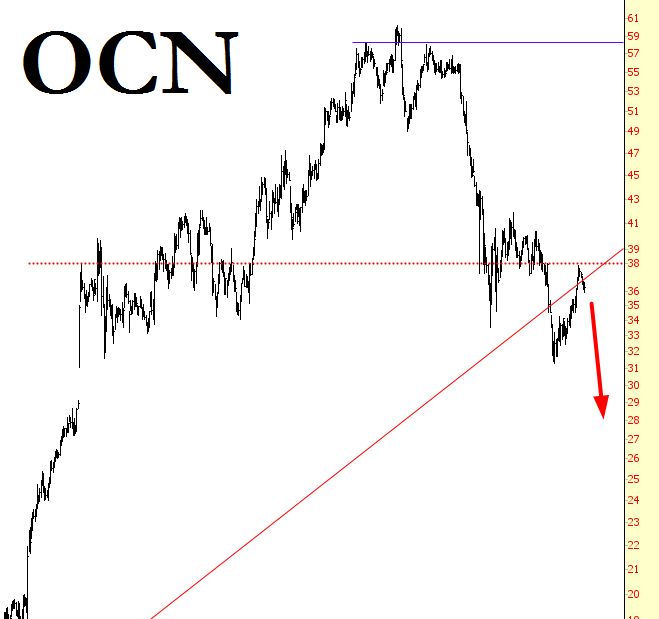
Way back in June 2014, Ocwen Financial broke a trendline dated back to 2008. I did a post suggesting either shorting it or buying puts. Here was the chart at the time of the breakdown:

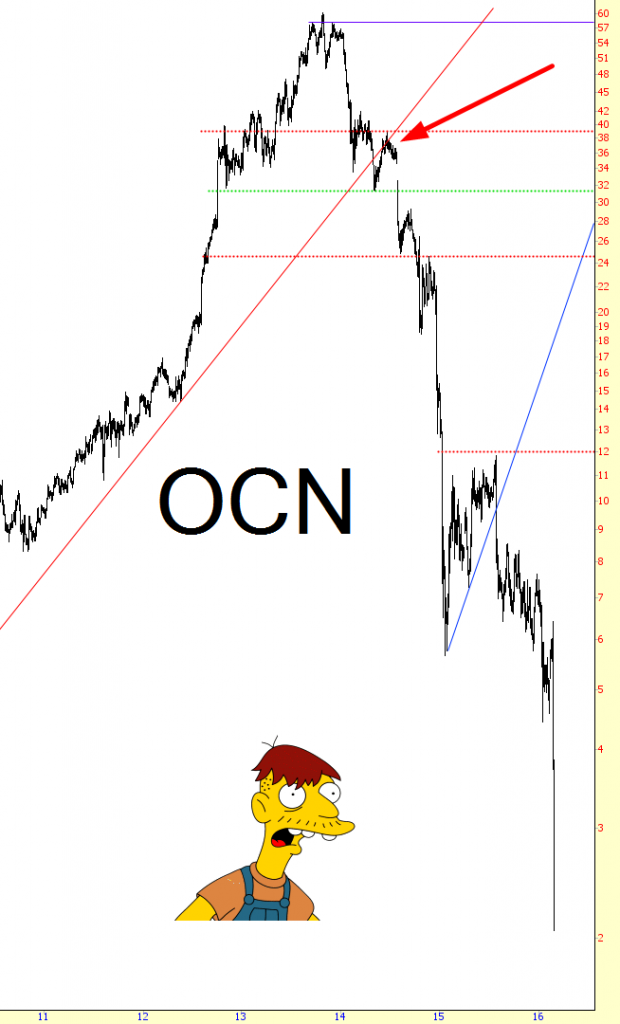
Let’s follow up on that, shall we? I’ve put an arrow where the post was made.
Keep the faith, charting brethren.


Leave A Comment