Expansionary fiscal policy combined with Taylor-rule induced monetary tightening has resulted in a strong dollar. That strong dollar is driving US agricultural prices.
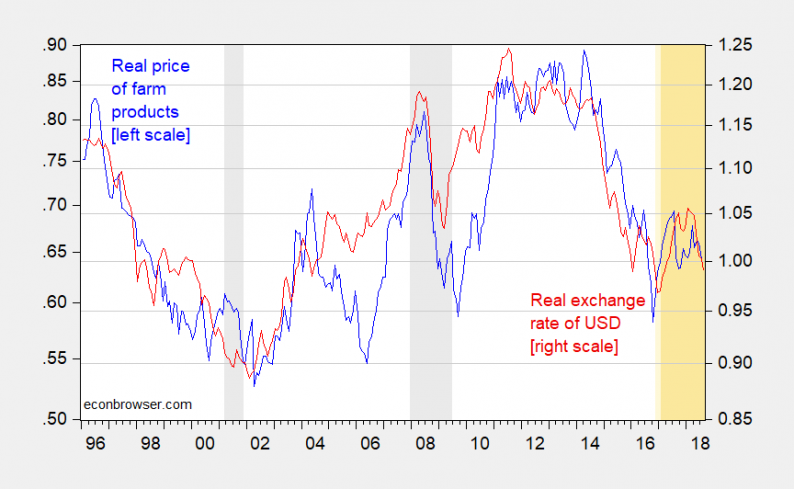
Figure 1: Farm product PPI divided by CPI-all (left log scale, blue), and real trade weighted US dollar exchange rate, against broad basket (right log scale, red). An increase in the dollar exchange rate variable is a dollar depreciation. NBER defined recession dates shaded gray; Trump administration shaded orange. Source: BLS, Federal Reserve Board, NBER, and author’s calculations.
Notice the close correlation between the inflation adjusted series. Neither series rejects a unit root, using conventional ADF tests. A Johansen maximum likelihood test for cointegration rejects (using asymptotic critical values) the no-cointegration null at the 12% msl, but fails to reject the one cointegrating vector at the 10% msl (for both trace, maximal eigenvalue test statistics).
The estimated cointegrating vector (assuming no trend in cointegrating equation) is:
ppifarm = 1.43q – 0.475
Where ppifarm is the log PPI for farm products deflated by CPI-All, and q is the real dollar exchange rate.
From March 2018 — when the first protectionist measures were announced — through August, the real value of the USD has fallen by 5.8% (log terms). That implies an 8.3% real price reduction in farm prices since March, alone.
The interpretation I’ve adopted is that the real dollar is weakly exogenous (i.e., the cointegrating vector is weakly exogenous for relative farm prices). This seems reasonable from a theoretical perspective, where farm prices do not “cause” the value of asset prices like the dollar.
However, it’s reassuring that the VECM that corresponds to the cointegrating system estimated is one where one can reject the null hypothesis that farm prices respond to statistical disequilibria, while the dollar does not.


Leave A Comment