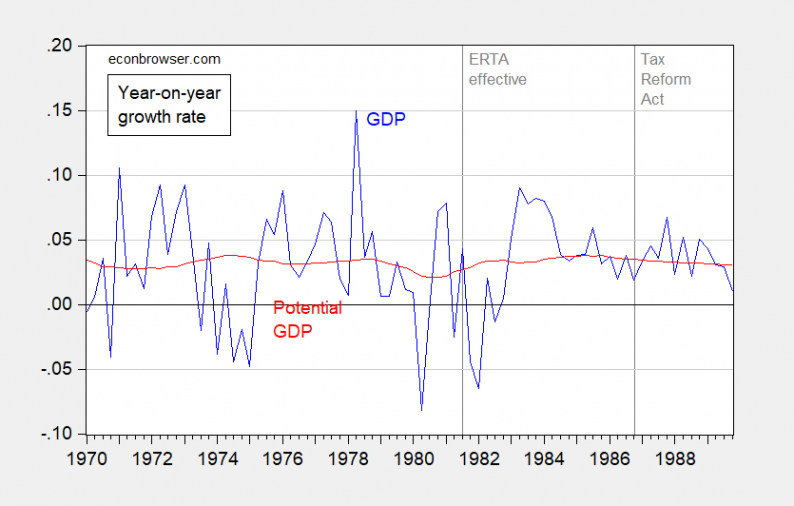
I keep on hearing about the supply-side miracle associated with the the Reagan era tax cuts. What do changes in estimated potential versus actual output suggest?

Figure 1: Year-on-year growth rate of real GDP (blue), and of potential GDP (red), calculated as 4th differences of logged values. Dashed lines at effective dates for Economic Recovery Tax Act of 1981 and Tax Reform Act of 1986. Source: BEA, CBO.
The variation in actual output clearly exceeds that of potential GDP, suggestive of a nonvertical aggregate supply curve. (It’s also interesting to see that potential GDP growth was accelerating before the enactment of the first Reagan tax cut; it also decelerated after the 1986 Tax Reform Act.)
Now, it could be that CBO mismeasured potential GDP. Is there another way to determine whether supply side or demand side effects dominated? The answer is yes: examine the covariation of the price level and output.
Consider first what inflation adjusted by expected inflation did, vs. GDP growth.

Figure 2: Q/q annualized CPI inflation minus expected one year CPI inflation versus q/q annualized GDP growth, 1981Q1-1989Q1. Source: BLS, BEA, Survey of Professional Forecasters, and author’s calculations.
Notice the upward slope in the scatterplot. Now, second, consider what the pattern of observations would be if the supply side scenario of an outward aggregate supply curve shift occurred (Figure 3); potential GDP Yn increases to Y’n.
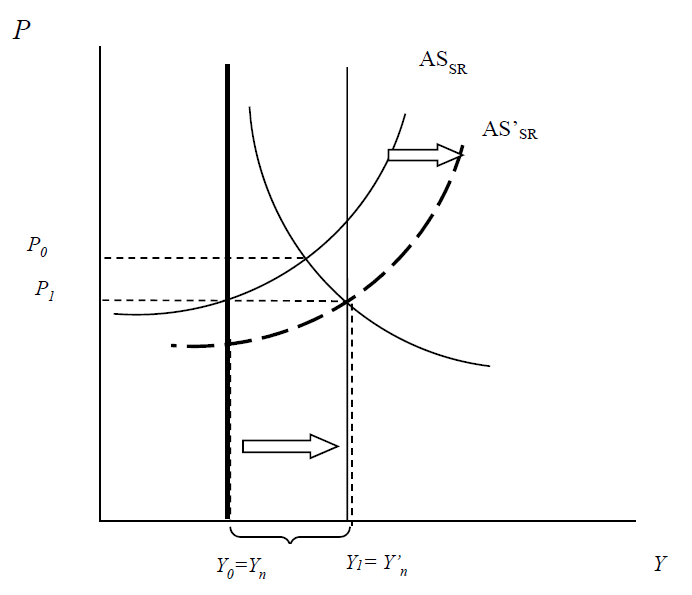
Figure 3: Rightward shift in long run aggregate supply curve.
The observations would line up along a downward sloping line, corresponding to movement along the aggregate demand curve.
Third, if the aggregate demand curve shifted, it would trace out an upward sloping line, corresponding to movement along the short run aggregate supply curve, as shown in Figure 4.


Leave A Comment