
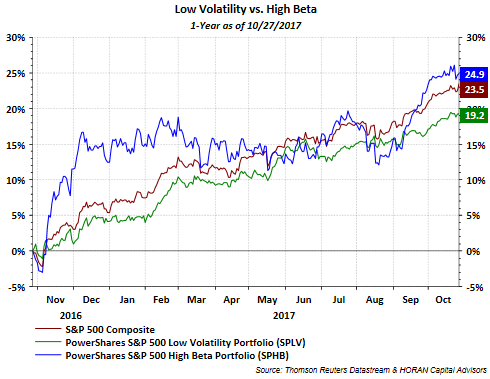
I have read commentary over the last few days noting the outperformance of the PowerShares High Beta Index (SPHB) versus its counterpart, the PowerShares Low Volatility Index (SPLV) over the past 1-year time frame. However, much of this outperformance was generated in the couple of months following the November election.
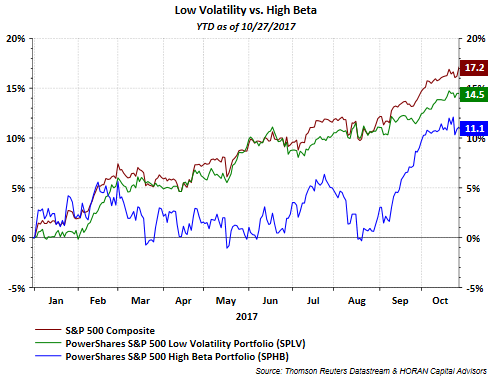
When looking at the year to date performance of the high beta versus low volatility indexes, low volatility has been outperforming this year. Since August though the high beta index seems to have gained significant upward momentum versus the low volatility strategy. Both indexes trail the S&P 500 Index this year.
For investors, looking at the composition of both indexes and their construction differences is important and may provide some insight into market expectations. Notable index differences from a year ago are as follows and weightings are not too much different today:
As the first chart above shows, high beta had significant outperformance versus the low volatility index from the election to early December last year. Much of this outperformance was driven by financials, energy, materials and information technology. These sectors tend to be economically sensitive ones and the euphoria following the election had the market believing a pick up in economic activity would result from one party controlling Congress and the White House.

The inability of Congress to pass legislation that would be viewed as stimulative to economic growth was quickly realized by the market. From December until August of this year, the high beta strategy was out of favor relative to low volatility. During this time period the more defensively oriented sectors gained favor, i.e., utilities, consumer staples, healthcare was strong performer and high beta is underweight healthcare, financials lagged. As the below year to date performance analytics table shows, low volatility continues to outpace high beta. This is evident by the negative 3.5% relative performance, remembering the portfolio is the high beta ETF and the benchmark is the low volatility ETF; thus, high beta is under performing low volatility.


Leave A Comment