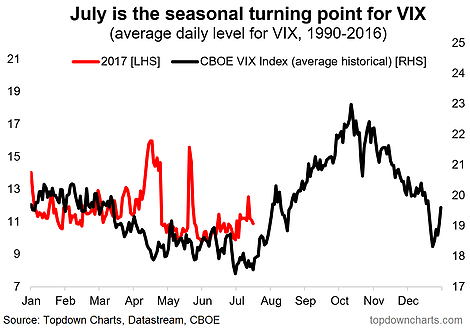
The topic of seasonality is a controversial one among investors. Some swear by it, referring to studies that present evidence for a reliable seasonal pattern across the year, verified across global equity markets. Others dismiss it as noise; nothing but a random assembly of outliers – or ignore it due to a lack of reliability. But whatever your view is, the historical averages, the numbers, the data, appear to show a distinct pattern. And while you can often get lost or deceived in the averages, the chart below shows that July (i.e. now) is the turning point for stock market returns and volatility.
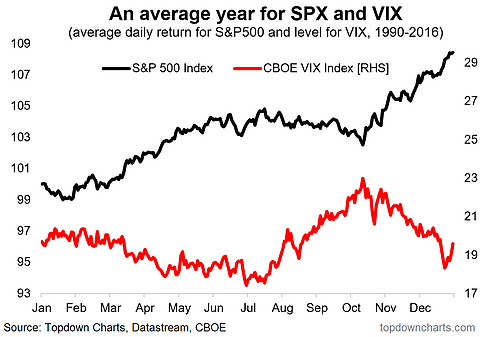
The historical seasonal pattern is that the VIX (implied volatility) tends to rise on average from July through October. The second chart shows, much as you would expect, that the stock market itself is typically weak through that period also. The rule of thumb for seasonality is you don’t want to rely on it, but incorporate it as one factor among many into your investment process. For example, if you said S&P 500 valuations are expensive, the Fed is hiking rates, lending standards have tightened somewhat, sentiment is increasingly bullish, and there are a few geopolitical risks lurking in the shadows… and then pointed to the negative seasonality that has historically characterized the July-October period, you might come to a conclusion that the risk of a correction is elevated short term…
Here’s how the VIX is trading so far during 2017 vs the historical average level from 1990-2016. Typically July is the seasonal turning point.

Putting it into context with the S&P 500 itself, here’s the stock market risk vs return seasonality map.


Leave A Comment