
Now that the S&P 500 has made a new all-time high, we can put the January-February 2018 “small correction” behind us and focus on what lies ahead.
For starters, the S&P 500’s forward returns are pretty bullish (see study).

Now let’s get into the details. My recent tweet sums up my market outlook going into 2019.
Before anyone accuses me of being a permabull, my view throughout this entire year has remained the same:
The U.S. stock market will rally into 2019. Bull market top somewhere in mid-second half of 2019. Then bear market.
See this chart. Like 1929 and 1998 pic.twitter.com/2HWd1Lw4CX
— Troy Bombardia (@bullmarketsco) August 21, 2018
Based on where the Medium-Long Term Model is today, the bull market’s top is going to be somewhere in mid-2019. This is a MOVING target. The target date will move as new data comes in. But the key point is that we should have smooth sailing for the next 6-9 months.
Why this is shaping up to be more like 2000 than 1929
Gray Cardiff has a very interesting stock market valuation indicator. This valuation indicator is the ratio of the S&P 500 to the median home price in the U.S.
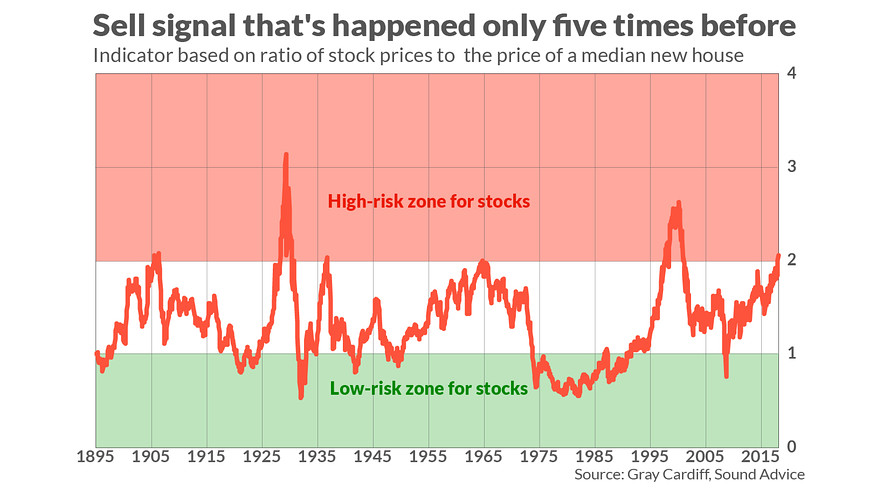
As you can see, the stock market is getting close to the “high risk zone”. However, it is important to note that this indicator is not a medium term market timing tool. In previous cases in which this indicator reached 2.0, the stock market trended higher for months and sometimes years.
I find it particularly interesting that for the 2 historical cases in which this indicator exceeded 2.0 (1929 and 1998), the stock market made a blow off top. It SOARED in the final 1-1.5 years of its bull market.
Can the same thing happen again? I certainly think so. The S&P 500 rallies 10%+ per year in the final year of its bull market (i.e. leading up to 1968 top, 1973 top, 2000 top, 2007 top).


Leave A Comment