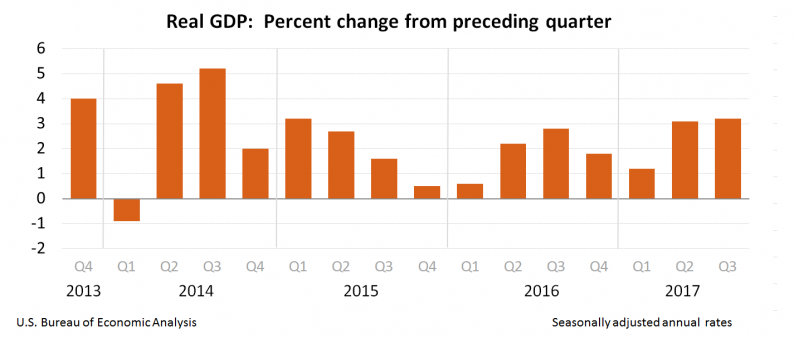
The third estimate of third quarter 2017 Real Gross Domestic Product (GDP) decreased marginally to 3.2 %. Sorry for the delay in publishing this post – but the internet sucks on Princess Cruises and they don’t care. Specifically I would like to thank Brian OConnor, Vice President, Public Relations for Princess Cruises who refused my request for assistance.
Analyst Opinion of GDP
The consumer spending declined, but the real improvement came from using a lower inflation deflator. I am not a fan of quarter-over-quarter exaggerated method of measuring GDP – but my year-over-year preferred method showed moderate acceleration from last quarter.
The market expected:
Advance
Actual
Second
Actual
Third
Actual

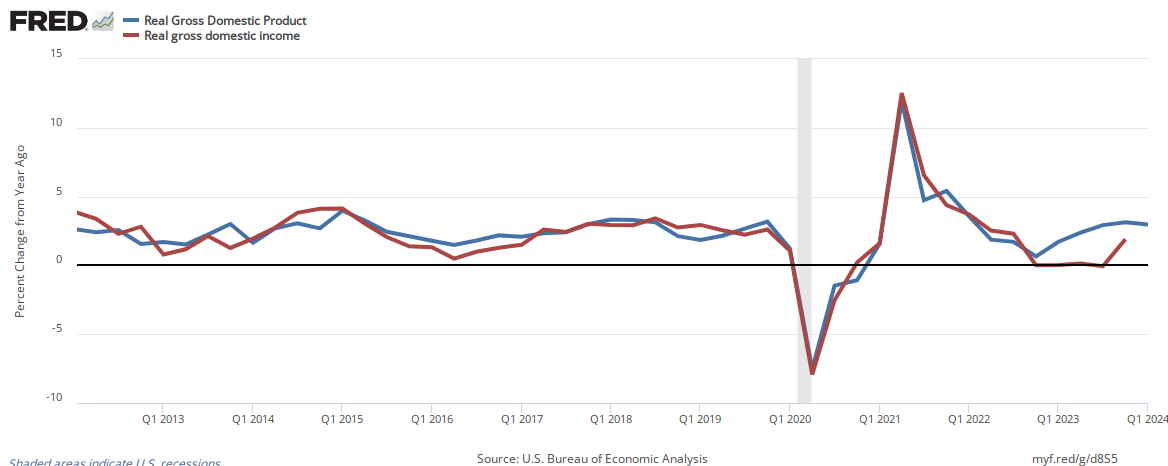
The same report also provides Gross Domestic Income which in theory should equal Gross Domestic Product. Some have argued the discrepancy is due to misclassification of capital gains as ordinary income – but whatever the reason, there are differences.
Real GDP (blue line) Vs. Real GDI (red line) Expressed As Year-over-Year Change
The GDP estimate released today is based on more complete source data than were available for the “second” estimate issued last month.


Leave A Comment