I’ve been trading and teaching for more than 25 years. Since 2009, I’ve taught 300,000 traders the specific ways they can spot high-probability, low-risk trades.
So I think this is the perfect time for an “anniversary present.”
It’s a priceless antique, more than 300 years old, and it comes all the way from the Japan of the samurai.
And it’s incredibly useful. You can use it to trade the right way and make serious money every day.
Let me show it to you…
More Powerful Than Prediction
I love predictive indicators, like the relative strength index and moving average convergence/divergence. Of course, my favorite is my Money Calendar, which crunches thousands of data points going back more than 10 years to predict the direction and patterns of some of the markets’ best, most liquid stocks. It suits me.
Still, no matter what kind of technical prediction tools we have handy, certain events can happen – global or domestic, in the markets or out – that we just have no way of predicting.
For that, we need a reliable source to tell us exactly how the market is reacting, in real-time.
That’s where my 18th century anniversary present comes into play. It’s called “candlestick” charting, and it’s one of my favorite ways to get an instant read on the markets’ sentiments.

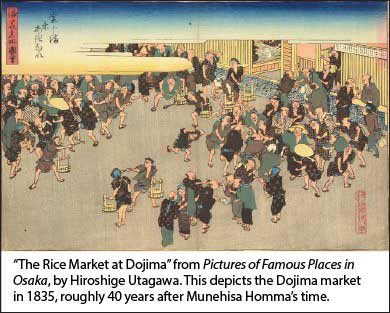
It’s hard to say who inventedthis charting technique, but the person who made the most of it, the man we call “the father of the candlestick chart,” was a trader called Munehisa Homma (1724-1803).
Homma was a rice merchant… and a lot more… in 18th century Sakata, Japan. He recognized that quality information was critical, and let me tell you, Homma had “the goods.” He’s thought to have had a network of men, or agents, stationed every 6 kilometers (3.7 miles) along the 600-kilometer (372 mile) distance between Sakata and Osaka, so he’d have a better picture of market prices across a wider slice of Japan – and a huge lever over the competition in Sakata.


Leave A Comment