Following futures positions of non-commercials are as of August 7, 2018.
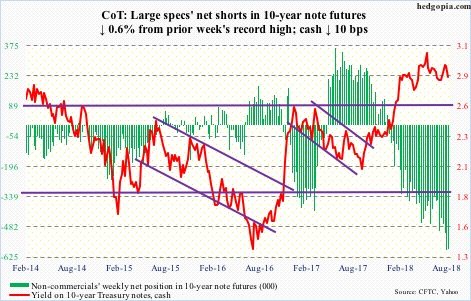
10-year note: Currently net short 586.3k, down 3.8k.
The 10-year Treasury yield (2.86 percent) continues to work on a potentially bearish head-and-shoulders formation. On August 1, it hit 3.02 percent intraday before getting repelled at the daily upper Bollinger band. Staying above three percent has proven difficult. For the first time since January 2014, yields rose over three percent in April this year, followed by another test mid-June.
Should the 10-year continue lower, the neckline will be tested at 2.8-2.85 percent. It will be a crucial test. If nothing else, just for the fact that non-commercials are neck-deep in net shorts in 10-year note futures. A breach of this support likely forces a squeeze – magnitude notwithstanding. In a scenario in which a self-fulfilling prophecy kicks in, yields can come under decent pressure.
30-year bond: Currently net short 31.9k, up 11.3k.
Major economic releases next week are as follows.
Tuesday, the NFIB small business index for July is reported. It fell six-tenths of a point month-over-month in June. May’s 107.8 was the second highest reading in its 45-year history.
Retail sales (July), productivity (2Q18, preliminary), industrial production (July) and the NAHB housing market index (Aug) are on tap Wednesday.
Retail sales jumped 6.6 percent year-over-year in June to a seasonally adjusted annual rate of $506.8 billion. This was the fastest growth rate since February 2012.
Non-farm output per hour rose 0.4 percent in 1Q18. Productivity remains subdued.
Capacity utilization rose 2.3 percent y/y to 78 percent in June. Utilization has risen since bottoming at 75 percent in November 2016.
Builder sentiment in July was unchanged m/m at 68. Last December’s 74 was the highest since July 1999.
July’s housing starts is scheduled for Thursday. Starts collapsed 12.3 percent m/m in June to 1.17 million units (SAAR). May’s 1.34 million was the highest since July 2007.
Friday brings the University of Michigan’s consumer sentiment index for August. July inched down three-tenths of a point m/m to 97.9. March’s 101.4 was the highest since January 2004.


Leave A Comment