
The following investment idea is VERY RISKY. ACCEPT THE FACT YOU COULD LOSE YOUR ENTIRE INVESTMENT. If this makes sense to you, buy in-the-money puts.
Motor vehicle sales were an 18.1 million annual rate in December 2015. They fell to a 16.6 million annual pace in April, rebounding slightly to 17.4 million in May. But big sales incentives drove the latest sales increase. From the Detroit News:
Helping increase Fiat Chrysler’s April sales were some of the highest incentives in the industry of nearly $4,000 on average per vehicle sold, up 25.1 percent from a year ago, according to TrueCar.
That compares to a 14 percent increase at GM, with $3,909 in incentives, and a 24 percent increase at Ford to $3,423. The industry on average was up 13.3 percent to $3,021 in incentives per vehicle sold, TrueCar reports.
Increased incentives eat into company profit margins. They also signal consumers need increased coaxing to make the sale.
It’s possible that auto sales have topped for this cycle.Consider the following chart from Econoday:
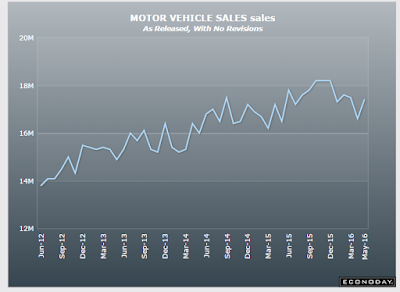
With the exception of the spike in 4Q15, this data series has moved sideways since September 2014.
The following chart from Doug Short contains a 9-month moving average that shows a decline in the trend since the end of last year:

The broader picture of personal consumption expenditures also shows demand weakness:

Above is a 1-year chart showing the monthly percentage change in personal consumption expenditures (“PCEs”; blue bars) and PCEs of durable goods (red bars). Monthly PCEs have slowed: the last 4 readings are barely positive. Durable goods purchases contracted in 4 of the last 5 months. Clearly, consumers are slowing their purchases. And this is occurring within a broader slowdown in economic growth and slightly weaker employment gains.
Let’s now turn to the daily Ford and GM charts:


Leave A Comment