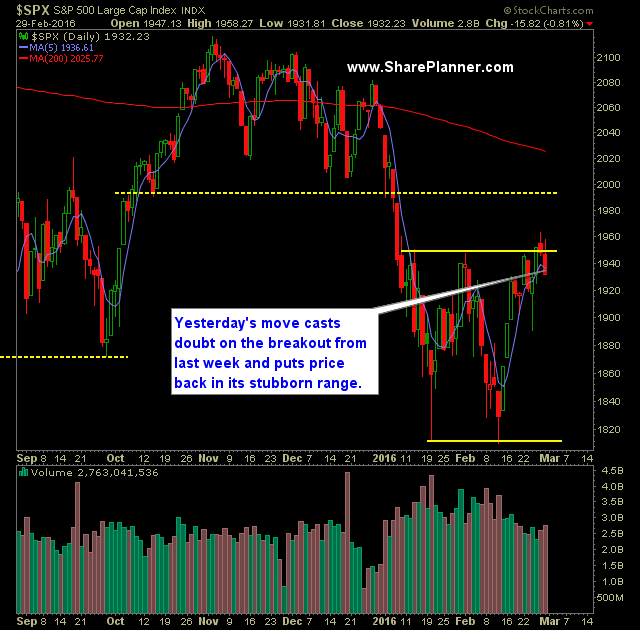
SPX pulled back yesterday hard and into the price range that has plagued the market for all of 2016 so far – between 1810 and 1950.
With it, the price action closed just slightly below the rising trend line off of the 2/11 lows on the 30 minute chart. Some may even consider it a close right on the trend-line.
With the price action yesterday, the 5-day and 50-day moving average was broken.
Overnight price action in the futures has SPX looking at a significant gap up this morning if the strength holds.
Price gains over the last two gains have been lost as afternoon trading wore on.
Volume was slightly less yesterday than the day prior and below recent averages.
Over the past 10 years the first day of the trading month has been notoriously bullish, but in recent months it has been a mixed bag, with the last two months resulting in closes lower.
February marked the third month in a row SPX has finished lower on a monthly basis. This hasn’t happened since the summer sell-off of 2011.
VIX bounced 3.8% yesterday to close at 20.55 and showing signs of wanting to bounce higher.
T2108 (% of stocks trading above their 40-day moving average) rose 2.5% to 60.7% – this despite the fact that SPX continued to trade lower through out the afternoon. This indicator, bettern than anything else, shows the overbought nature of this market currently.
For the bulls, a close above the Friday’s highs is necessary.
My Trades:
Added one new short position to the portfolio yesterday.
Did not close out any positions yesterday.
Currently 10% Short, 90% Cash
Will look to add 1-2 new positions and follow the market’s direction


Leave A Comment