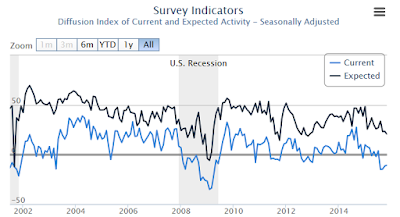
On Monday, the Fed regional reports kicked off with the Empire State report, a survey of manufacturing conditions in the general New York region.
The survey asks manufacturers about activity, new orders, hiring, workweek hours, prices paid, prices received, inventory levels, and overall conditions.
For details please see Empire State Manufacturing Negative Fourth Month, Work Week Lowest Since Mid-2011.
The survey also asks manufacturers what they think general conditions will look like in six months. Here is the chart presented in the Empire State Survey.
Current Business Conditions vs. Expected Conditions Six Month From Now

To see if there is any merit in tracking future projections, I downloaded the data, and shifted the projections ahead by six months to plot current conditions vs. what the manufactures expected to happen.
Current Business Conditions vs. Expected Business Conditions (For Now – Made Six Month Ago)
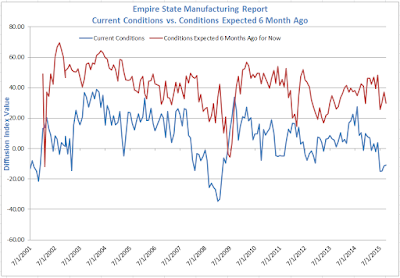
Perpetual Overoptimism
The perpetual overoptimism is impossible to miss. Here are the readings for 2015.
In 167 months, nearly 14 years of data, there were only five months (just under 3% of the time) in which current conditions exceeded projections made six months previous!


Leave A Comment