Buying EUR/USD Scenario
If it comes out lower than expected at a relative deviation of -0.88 or less(4.03 or lower in actual terms), the EURUSD may go up reaching a range of 28 pips in the first 15 minutes and 72 pips in the following 4 hours.
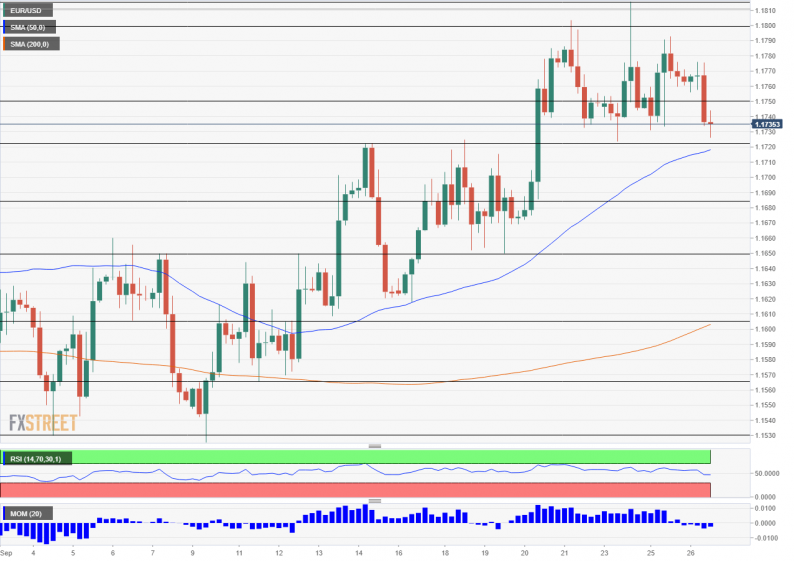
1.1750 was a battle line in late September. 1.1800 is a round number and it is followed by the high of 1.1815. The mid-June spike at 1.1850 is next up, followed by 1.1915 and 1.2000.
Selling EUR/USD Scenario
This time, if it comes out at higher than expected with a relative deviation of 0.68 or higher(4.32 or higher in actual terms), the pair may go down reaching a range of 26 pips in the first 15 minutes and 82 pips in the following 4 hours.
1.1720 separated ranges in late September. 1.1680 was a pivotal point in mid-September. 1.1650 was a swing low earlier in the month. 1.1605 served as support and it is followed by 1.1565 and 1.1530.
EUR/USD Levels on the Chart

More data
US growth was robust in the second quarter of 2018. The second release showed an annualized increase of 4.2%, the fastest in four years. The deviations are usually small in the third and final publication, but surprises are not uncommon.
Follow the publication of the figure on the economic calendar. Watch out for the data from the Market Impact tool, projecting the potential price changes according to the deviation. Here is the Market Impact Studies Users Guide.


Leave A Comment