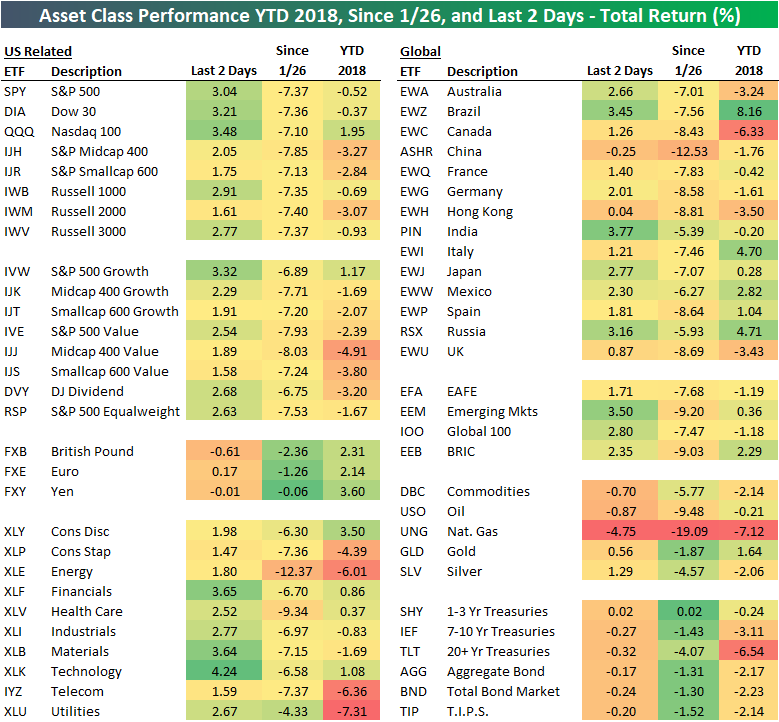
With the S&P 500 now up more than 3% since the close on Thursday, we thought it was a good time to update our asset class performance matrix to see what else has been moving the most over the past two trading days. The matrix below highlights the total return of each ETF over the last two days, since the close on 1/26 (which was the date of the S&P’s last all-time high), and year-to-date.
As shown, the Nasdaq 100 (QQQ) is up the most of the US index ETFs with a gain of 3.48%, while the small-caps (IWM, IJH) are up less than 2%.Looking at US sectors, Tech (XLK), Financials (XLF), and Materials (XLB) are up the most, while Consumer Staples (XLP), Energy (XLE), and Telecom (IYZ) are up the least.
Outside of the US, India (PIN), Brazil (EWZ), and Russia (RSX) are up the most over the last two days, while China (ASHR) is actually down and Hong Kong (EWH) is only up 4 basis points.The emerging markets ETF (EEM) has also posted a nice gain of 3.5%.
Commodities (DBC) are down by 0.70% over this period, with oil (USO) and natural gas (UNG) leading the way lower. Treasury ETFs are down slightly as well during this two-day equity rally.


Leave A Comment