
We’ve been following the setups on both sides of EUR/USD of late, and a very similar type of stance can be taken on DXY as a representation of the U.S. Dollar. The Dollar started a rather aggressive top-side run in 2014 that eventually set a fresh 14-year high in January of this year. But after that high was set, matters changed and the Greenback then spent most of the next nine months heading-lower. As we moved into September, 50% of that prior bullish move had been retraced as some element of support finally began to show.
U.S. Dollar via ‘DXY’ Weekly: 50% Retracement of 2014-2017 Move in First Nine Months of 2017
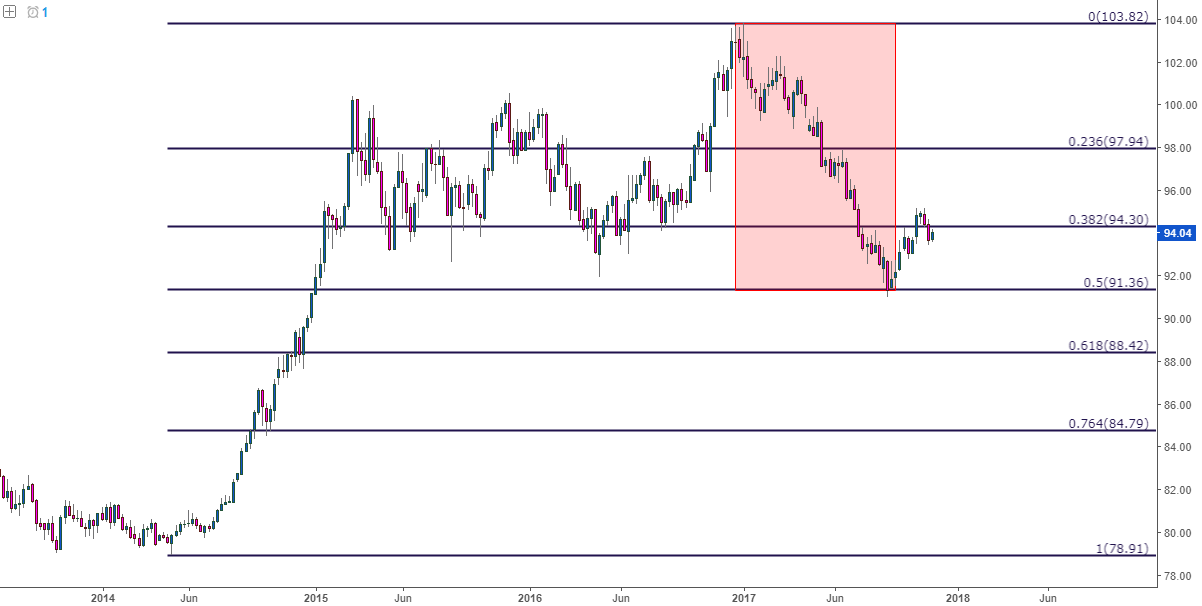
The 50% retracement of that move was traded through for one day before buyers began to take over. By the time we got to October, prices had already started testing a key zone of resistance that runs from 94.08 to 94.30, with 94.30 being the 38.2% Fibonacci retracement of that same major move. After resistance held for most of the month, USD finally broke out on October 26th as the ECB announced an extension of their stimulus program. This brought-in a fresh three month high in the Greenback, along with the prospect of bullish continuation as we moved towards year-end.
But after having been flummoxed at the 95.00 psychological level, DXY dropped below that key zone last week after a red-hot GDP report out of Germany. Prices fell back below the 94.08-94.30 zone, and support eventually showed-up around the prior swing-low around 93.50. Since then, that support has held and buyers have gradually began to push prices back into that key zone.
U.S. Dollar via ‘DXY Four-Hour: Strength Falters at 95.00, Prices Fall Back-Below Support Zone
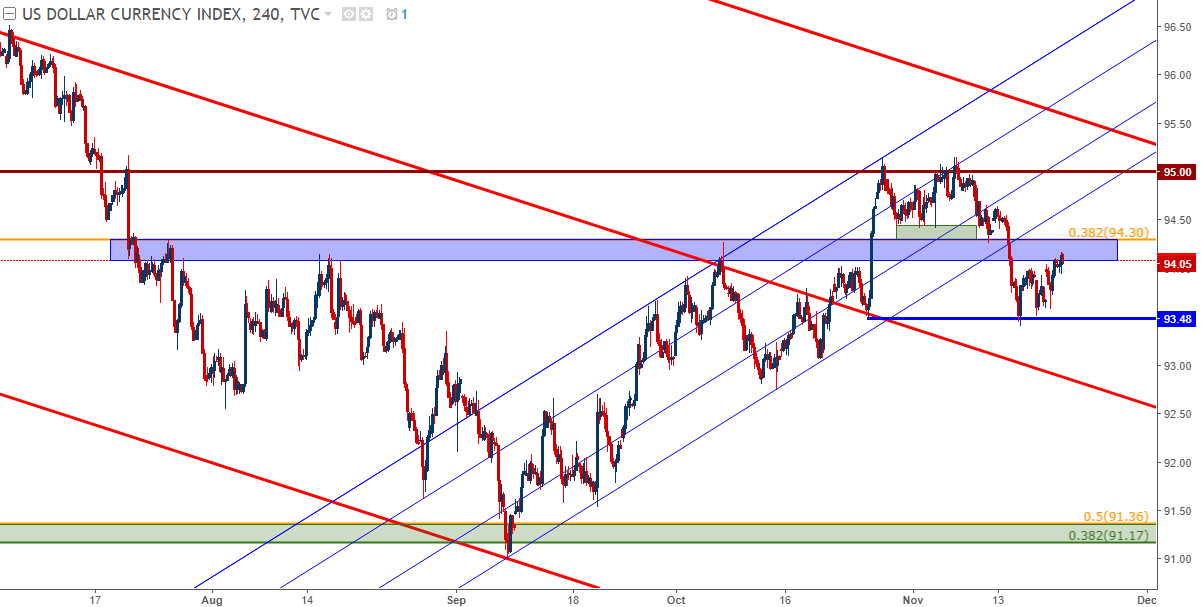
At this stage, the Dollar is moving-up to test a key area of short-term resistance. Drawing a Fibonacci retracement around the bullish move in DXY that’s shown since September will highlight a confluent area around 94.17. This is the 23.6% retracement of that recent bullish move, while also intersecting with a bullish trend-line that was broken during last week’s drop. Prices are now finding resistance on the under-side of that trend-line.


Leave A Comment