
On Friday, we looked at how this week’s calendar picks up considerably from last week’s quiet outlay, and earlier this morning, my colleague Christopher Vecchio walked through some of the more pivotal high-impact data releases on this week’s docket. These data prints, combined with a few different key Central Banker speeches provide a backdrop with which we can continue to see volatility arise. Stocks began to shake on Thursday of last week, and over the weekend we discussed near-term trajectory across equity indices (also covered in our webinar on Thursday). In this morning’s Market Talk, we’re going to look at price action setups around the U.S. Dollar as we move into what could be a pivotal week for Foreign Exchange markets.
The U.S. Dollar Tests Support, Are Bulls Going to Bring Back the Bids?
Over the past week we’ve been looking for a deeper support check in the U.S. Dollar. After spending the first nine months of the year driving lower, buyers began to show up in the Greenback in latter-September, with price action remaining below a key zone of resistance from 94.08-94.30. When the European Central Bank extended their QE program in late-October, the U.S. Dollar finally broke-above that zone of resistance, eventually setting a fresh high around the 95.00 level. While this was happening, a bit of higher-low short-term support began to show around 94.44, just above that prior zone of resistance. This area held for about two weeks, until we finally saw a quick test on Friday ahead of the close.
U.S. Dollar via ‘DXY’ Four-Hour: Support Digs into Prior Resistance Zone
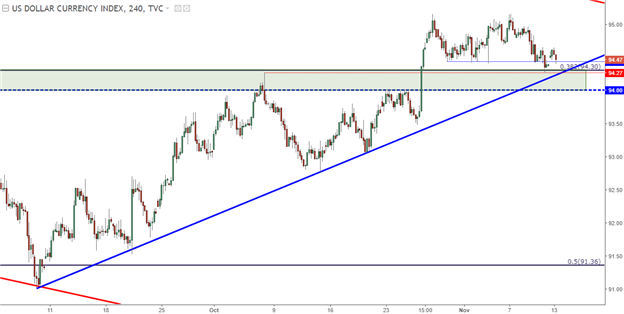
Chart prepared by James Stanley
At this point, buyers have pushed prices off of this support zone, but sellers came right back-in below the prior swing-high to push prices-lower. This gives us lower-lows and highs on the hourly chart below, and this could spell a deeper test within this support zone until the bigger-picture bullish trend is ready for resumption. A line of demarcation can be drawn from 94.65-94.75. This is where the previous near-term swing-high had shown up, and if buyers are able to push prices above that level, the prospect of bullish continuation will look considerably more attractive.


Leave A Comment