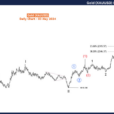
This week’s Chart of the Week features the U.S. Dollar Index (DXY) as it prepares to test the $93 level once again. The last time $93 was tested, we saw a rally above $94, however we are expecting $93 to fail this time around. Beyond $93, we are looking to break below the trendline at $92.85 and the bottom end of the channel indicated above at $91.55.
The relative strength index (RSI) for DXY is also indicating that a top formation has occurred when DXY hit $94. The last three times the RSI for DXY marked 70, we saw downside pressure and we expect the same to occur this time around.
In addition to the bearish technical setup here, is the markets pricing in a potential December Fed interest rate hike. At this point in time, we see a December rate hike roughly 90% priced into DXY which is what fueled the move from $91 to $94 that we saw over the last three months. As the December Fed meeting approaches, we should see downward pressure on the U.S. dollar as we have seen prior to the last three interest rate hikes.
Our target on this short trade is $89 (the support level formed by the bottom downtrend line on the graph above) and this should happen within the next four months.


Leave A Comment