
Price on the High-Yield Corporate Bonds ETF (HYG) has weakened further since my late-January post.
It’s now trading in between major resistance and support levels of 86.00 and 83.00, respectively, as shown on the following weekly comparison chart of HYG and the Russell 2000 Index (RUT). Volumes spiked to record highs on last week’s decline and the momentum indicator has fallen below the zero level, hinting of further weakness ahead on this timeframe.

The HYG:RUT weekly ratio chart below shows that HYG has underperformed the RUT since March of 2009.
However, this ratio strengthened during the past two weeks and is now caught up in between the medians of longer-term and shorter-term downtrending channels, and is below major price resistance of 0.06. The momentum indicator has popped above the zero level on this timeframe.

So, if HYG drops and holds below 83.00, and if the HYG:RUT ratio drops below the shorter-term channel median (currently around 0.0555) on a momentum break and hold below zero, look for further weakness ahead, not only in HYG, but, potentially, in the RUT, as well.
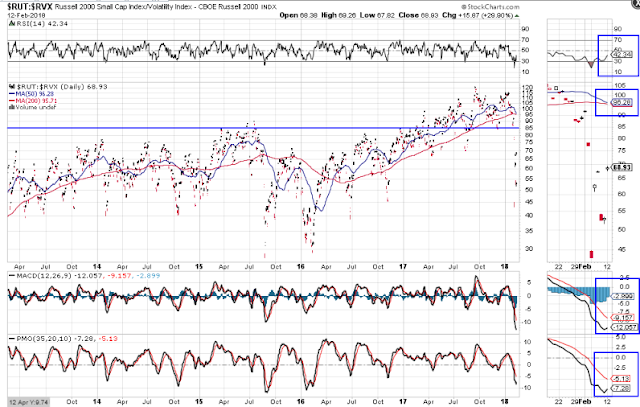
Volatility in the RUT has exploded over the past few days, as shown on the following daily RUT:RVX ratio chart.
Price has fallen below its major support level of 85.00 and we’ll likely see a bearish moving average Death Cross form in the next couple of days. As long as it remains below this level, we’ll continue to see wild, volatile swings in the RUT, and, likely further weakness in the days/weeks ahead.


Leave A Comment