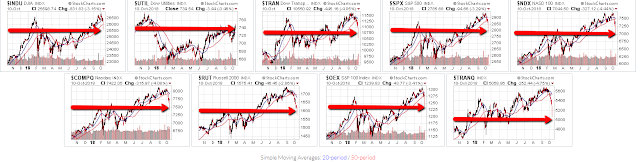
Further to my observations outlined in my posts of August 6 (where I noted that 2900 represented a major Fibonacci resistance level for the SPX), September 29 (where I mentioned the possibility of equity weakness for the first part of Q4 ahead of the November 6 mid-term elections), and September 29 (where I discussed price on four of the Major Indices being embroiled in a technical chaos formation amid downside accelerating rate-of-change), I’d note that after Wednesday’s dramatic drop in U.S. markets, they are now sitting on or close to near-term major support, as shown on the following daily charts of the nine Major Indices.

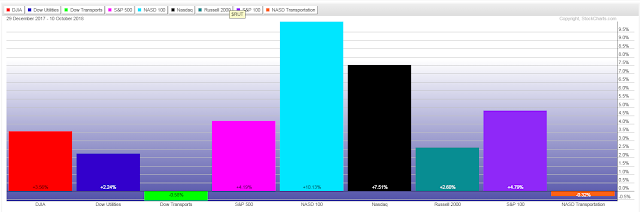
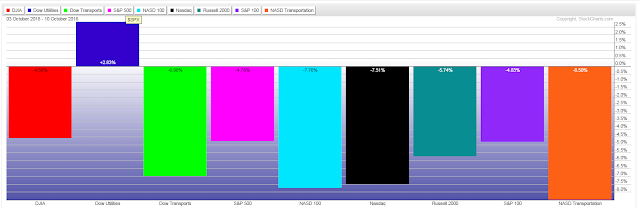
Most of them are still hanging onto some of their year-to-date percentage gains, as shown on the first graph below…but have lost a hefty percentage in the past week, as shown on the second graph.
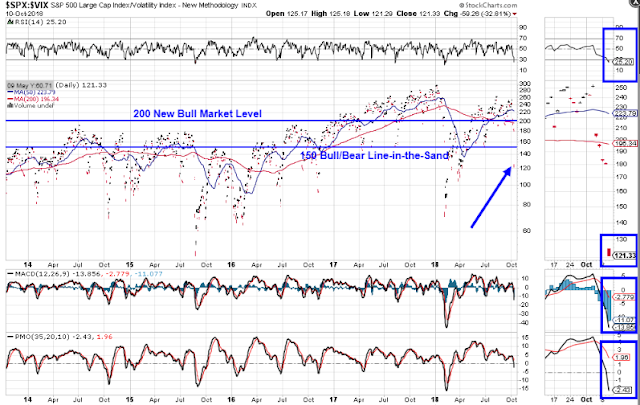
Price on the SPX:VIX ratio has fallen well below both the 200 New Bull Market level and the 150 Bull/Bear Line-in-the-Sand level, as shown on the following daily ratio chart.
All three technical indicators have sunk below their respective neutral levels (50 for the RSI and zero for the MACD and PMO) and are accelerating to the downside, hinting of further weakness ahead for the SPX.
As can be noted on the following monthly chart of the SPX, longer-term major support sits around the 2600 level…a convergence of price support and a long-term median of an uptrending Andrew’s Pitchfork formation.
As the SPX made a new all-time high on this timeframe, the momentum and rate-of-change technical indicators did not. In fact, both of these have made a lower swing low and the ROC is now below zero…also hinting of further weakness ahead.
Keep an eye on these latest indicators, together with those identified in my above three posts, for short and longer-term gauges of either, further weakness, or a turnaround any time soon.


Leave A Comment