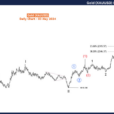
U.S. stock markets sold off viciously in recent weeks. Market conditions deteriorated fast, and the decline was aggressive and came quite sudden. Is this the start of the stock market crash of 2018? How comes the end of the 40-year bond bull market is not benefiting stocks? How low can U.S. stocks fall after the U.S. stock market breaks down in October 2018? We try to answer these questions in this article.
The U.S. stock market breakdown of October 2018 is about to become very serious and has already created serious damage to some leading sectors. Let’s revise this impact.
First, the Russell 2000 is our leading indicator for the U.S. stock market. It shows the breakdown of October 2018, where support broke. However, the index is now trading near the lowest and latest support level.
If, and that’s a big IF, the Russell 2000 can respect its lowest support level there may be hardly any damage done, even if leading sectors like the one outlined below are showing serious crackdowns.

Semiconductors, one of the leading sectors in the 2016 uptrend, as well as the 2013 uptrend, has visibly already broken down. What strikes us on this chart is the rounding top, certainly not a bullish event.
The semis will be neutral at best, and trade in a range between 1000 and 1300 points, or bearish at worst, falling to the 750 to 800 area.
![]()
Regional banks, another leading sector, has already fallen to its 2017 lows. It has broken down this week and is eyeing 39.5 points which, if it does not hold, may fall to 35 points.

This is a breakdown of the U.S. stock market in the making, without any doubt. Not a crash yet.
This is what we wrote recently:
Our advice is to closely watch what the U.S. dollar will do on its chart. Any weakness will be amazingly bullish for commodities and stocks. The opposite is true as well. This is a time in which chart analysis will pay off big time as charts will reveal all new trends.


Leave A Comment