We’ve updated our monthly workforce analysis to include last week’s Employment Report for January. The unemployment rate remained at 4.1%, and the number of new nonfarm jobs (a relatively volatile number subject to extensive revisions) came in at 200K.
The Unemployment Rate
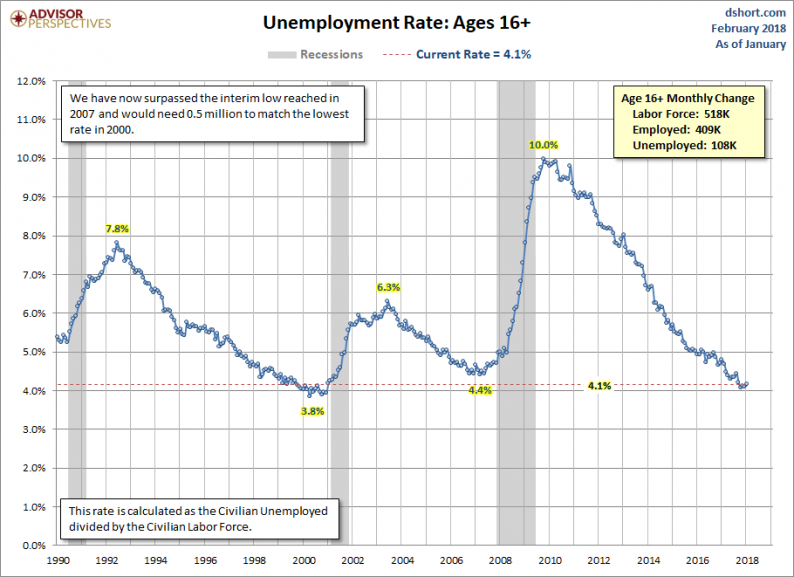
The closely watched headline unemployment rate is a calculation of the percentage of the Civilian Labor Force, age 16 and older, that is currently unemployed. Let’s put this metric into its historical context. The first chart below illustrates this monthly data point since 1990.
In the latest report, this indicator remained at 4.1%. The age 16+ population increased by 671 thousand, and the labor force (the employed and unemployed actively seeking employment) increased by 518 thousand. The number of employed increased by 409 thousand and the ranks of the unemployed increased by 108 thousand. These seemingly inflated figures are generally due to annual benchmark revisions that were made in the latest release.

Unemployment in the Prime Age Group
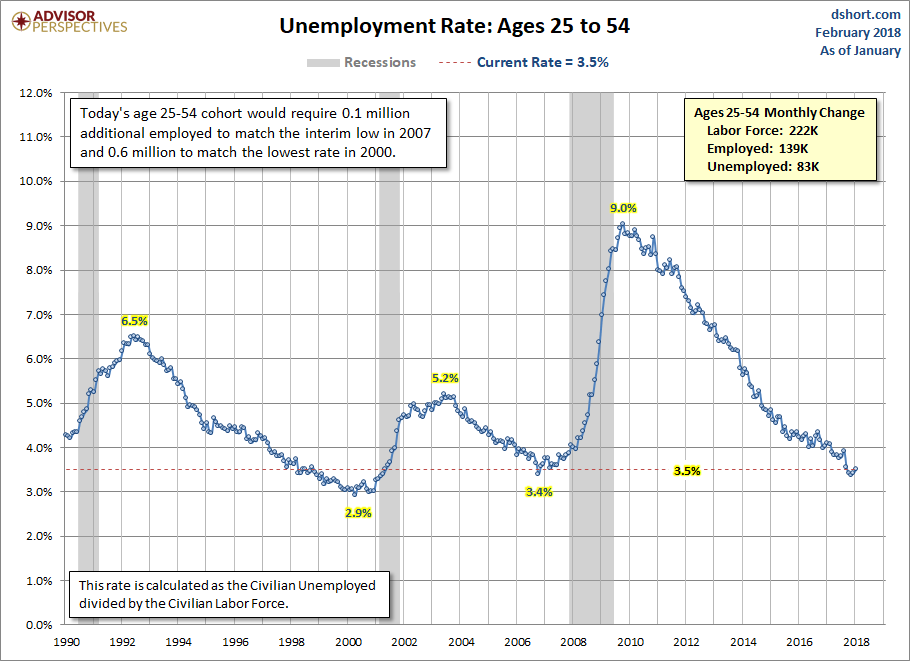
Let’s look at the same statistic for the core workforce, ages 25-54. This cohort leaves out the employment volatility of the high-school and college years, the lower employment of the retirement years and also the age 55-64 decade when many in the workforce begin transitioning to retirement … for example, two income households that downsize into one-income households.
In the latest report, this indicator inched up to 3.5% (to one decimal place) from the previous month. The cohort population increased by 371 thousand and the labor force increased by 222 thousand. The breakdown of the growth is an increase of 139 thousandemployed and an 83 thousand increase in the unemployed. Again, these larger figures are generally due to annual benchmark revisions that were made in the latest release.
A More Sobering Measure


Leave A Comment