
DOLLAR BEARS COME BACK AFTER YESTERDAY’S CPI-INDUCED SPIKE
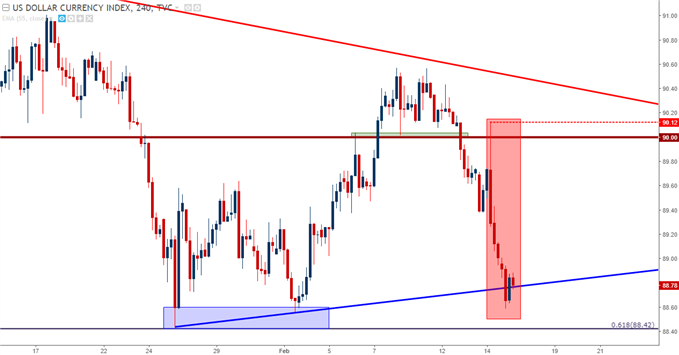
Yesterday’s Dollar-strength on the back of the US inflation report was short-lived. After getting a quick pop above the 90.00 level on DXY, Dollar bears came back with a vengeance and pushed prices all the way down towards the February lows, which are very near the three year-lows in the Greenback set in latter-January. This made for a rather impressive -1.7% run in DXY prices from yesterday’s high down to this morning’s low; and while this may not be the eye-popping double digit moves that can often be seen in equities, this is a -1.7% movement is for a non-levered currency; making for a notable move in a 24-hour period.
US DOLLAR VIA ‘DXY’ FOUR-HOUR CHART: BEARS COME BACK WITH A VENGEANCE AFTER TEST OF 90.00
10-YEAR US TREASURY YIELDS CROSS 2.9%
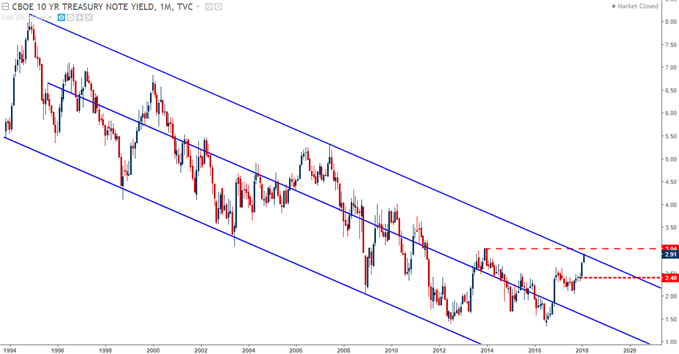
This move in the Dollar goes along with a continuation of selling in US Treasuries. Yesterday’s price action in the 10-year saw another fresh four year-high as yields are now above the 2.9% marker; furthering the outsized jump so far in 2018 after the 10-year hovered around 2.4% in December. This is a big move in a vitally important instrument in a very short period of time, and we’re fast approaching the seven-year high at 3.04%.
US TREASURY YIELD ON 10-YEAR NOTE, MONTHLY CHART: FAST APPROACHING SEVEN-YEAR HIGH 3.04%
THE US EQUITY BID CONTINUES AFTER YESTERDAY’S CPI-INDUCED DIP
Earlier in the month, that rise in yields had seemed to really grab the attention of equity investors. Stocks took a hit in the early-part of February, and after spending much of last week under pressure, bids have returned to push prices off of support. Yesterday produced a great example of the ‘buy-the-dip’ crowd at work, as a quick dip developed on the back of that US inflation report ahead of the US open. But, as American equity markets came online, buyers pushed prices higher and we’re back above 2,700 on SPX futures ahead of this morning’s open. Last week saw a swing show-up around 2726, and this could be looked at as an area of short-term resistance should this near-term rally continue:


Leave A Comment