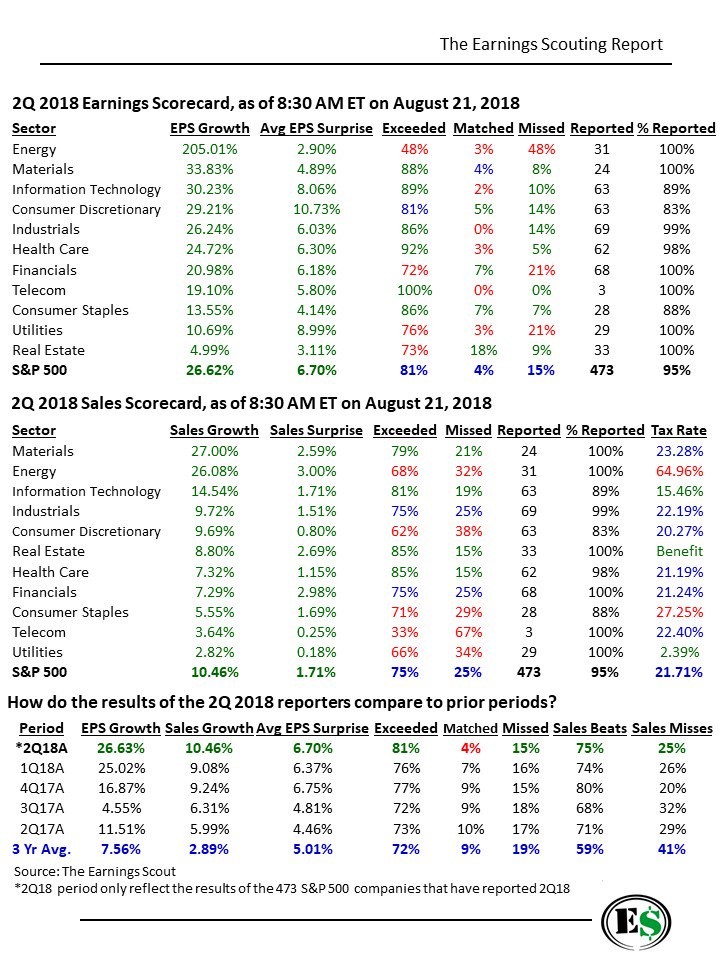
Since the S&P 500 earnings are growing 26.62% and the NFIB small business index is 0.1 away from its record high, you would think everything is perfect. That’s actually not true as we will get to later in this post. First let’s review the reason the S&P 500 is at its record high. As you can see from the top table created by The Earnings Scout, the average earnings surprise of 473 firms in the S&P 500 this quarter was 6.7% as 81% of firms beat estimates.

Source: The Earnings Scout
Consumer discretionary did the best since it had a 10.73% earnings surprise. It’s interesting that utilities had the 2nd to lowest earnings growth rate, but the second highest beat rate. On the other hand, energy had the highest growth rate, but it had a surprise rate of 2.9% and only 48% of firms beat estimates which were the worst on both fronts. Energy has been helped by oil on a year over year basis, but recent trends indicate that may not hold in 2019.
The second chart shows sales growth was equally remarkable as the average growth rate was 10.46% and the average beat rate was 1.71%, with 75% of firms surpassing estimates. You can see the strong earnings growth in utilities was driven by the tax cut because its effective tax rate was only 2.39% and its sales growth was only 2.82%. The materials sector had the strongest growth at 27% and energy had the best surprise rate at 3%.
The third table shows this quarter compared to the most recent ones and the 3 year average. Some bearish investors mistakenly claimed Q1 was going to be the growth peak. It seems likely that Q3 will be the growth peak. Q2 had faster EPS growth, sales growth, a better EPS surprise rate, and a higher percentage of firms beating sales estimates than Q1. In the past 3 years, which includes the earnings recession in late 2015 to early 2016, the average beat rate is 5.01% since firms have issued guidance they can beat, and analysts follow guidance when setting estimates.


Leave A Comment