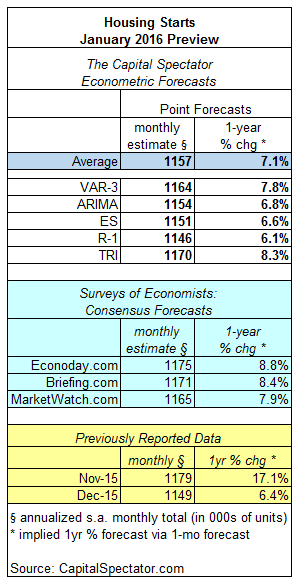
Housing starts are expected to total 1.157 million units (seasonally adjusted annual rate) in tomorrow’s January update, according to The Capital Spectator’s average point forecast of several econometric estimates. The projection represents a modest increase over the previous month’s level of residential construction activity.
Meanwhile, the Capital Spectator’s average forecast is below three estimates based on recent surveys of economists. Note, however, that all the forecasts anticipate that the year-over-year trend for housing construction will continue rising at a healthy pace.
Here’s a closer look at the numbers, followed by brief definitions of the methodologies behind The Capital Spectator’s forecasts that are used to calculate the average estimate:

VAR-3: A vector autoregression model that analyzes three economic series to project housing starts: new home sales, newly issued permits for residential construction, and the monthly supply of homes for sale. VAR analyzes the interdependent relationships of these series with housing starts through history. The forecasts are run in R using the “vars” package.
ARIMA: An autoregressive integrated moving average model that analyzes the historical record of housing starts in R via the “forecast” package.
ES: An exponential smoothing model that analyzes the historical record of housing starts in R via the “forecast” package.
R-1: A linear regression model that analyzes the NAHB Housing Market Index in context with housing starts. The historical relationship between the data sets is applied to the more recently updated NAHB Housing Market Index to project housing starts. The computations are run in R.
TRI: A model that’s based on combining point forecasts, along with the upper and lower prediction intervals (at the 95% confidence level), via a technique known as triangular distributions. The basic procedure: 1) run a Monte Carlo simulation on the combined forecasts and generate 1 million data points on each forecast series to estimate a triangular distribution; 2) take random samples from each of the simulated data sets and use the expected value with the highest frequency as the prediction. The forecast combinations are drawn from the following projections: Econoday.com’s consensus forecast data and the predictions generated by the models above (VAR-3, ARIMA, ES and R-1). The forecasts are run in R with the “triangle” package.


Leave A Comment