
Still Slowing Down
Year-end distortions have begun to slowly come out of the data, and while broad true US money supply growth remains fairly brisk, it has begun to slow again relative to January’s y/y growth rate, to 7.8% from 8.32%.

So far it remains in the sideways channel (indicated by the blue lines below) between approx. 7.4% and 8.6%, in which it has meandered since mid 2013. We believe the next break “below the shelf” is likely to be a significant event.
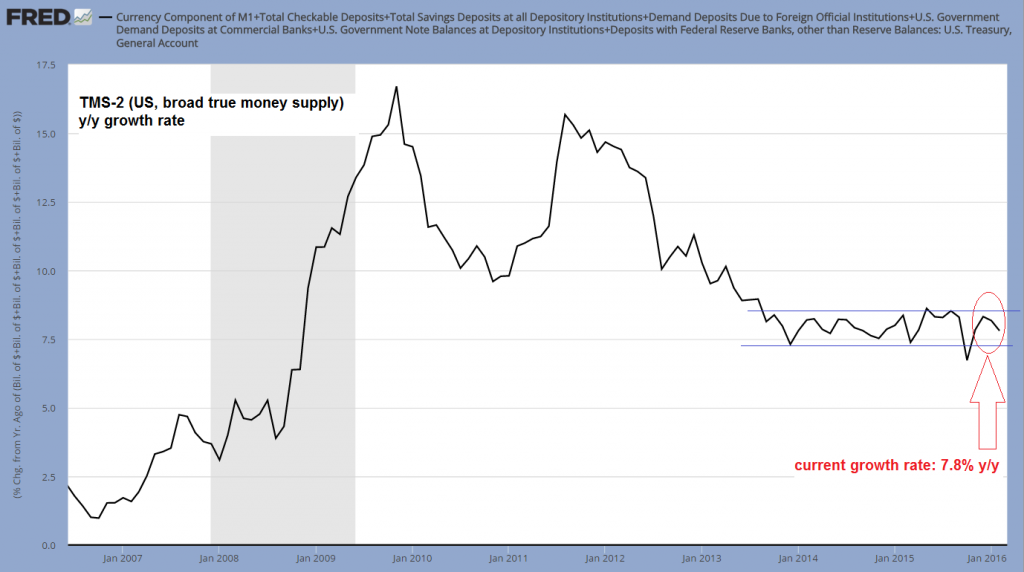
Broad true US money supply TMS-2, annual growth rate: still in the channel, but slowing again from January’s brief upward spike – click to enlarge.
Readers may recall that it was primarily the US treasury’s general account at the Fed which was responsible for the recent upward spike in the growth rate of TMS-2, combined with a year-end surge in deposit money. We suspect the latter had to do with offshore dollars being moved to domestic accounts at year-end for various accounting-related reasons. This suspicion has been confirmed by the fact that the move has been largely reversed in the new year.
As an aside, total bank credit growth (total loans and leases, excl. mortgage debt) stands at 8.24% y/y as of the end of February, which is still well below the peak growth rates seen in previous boom periods (these were closer to 13%).
As can be seen below, the amount of money held in the general account has declined further in February as well, but it seems to us that this money has merely moved into other demand deposits, i.e., there has simply been a shift from one categorization to another:
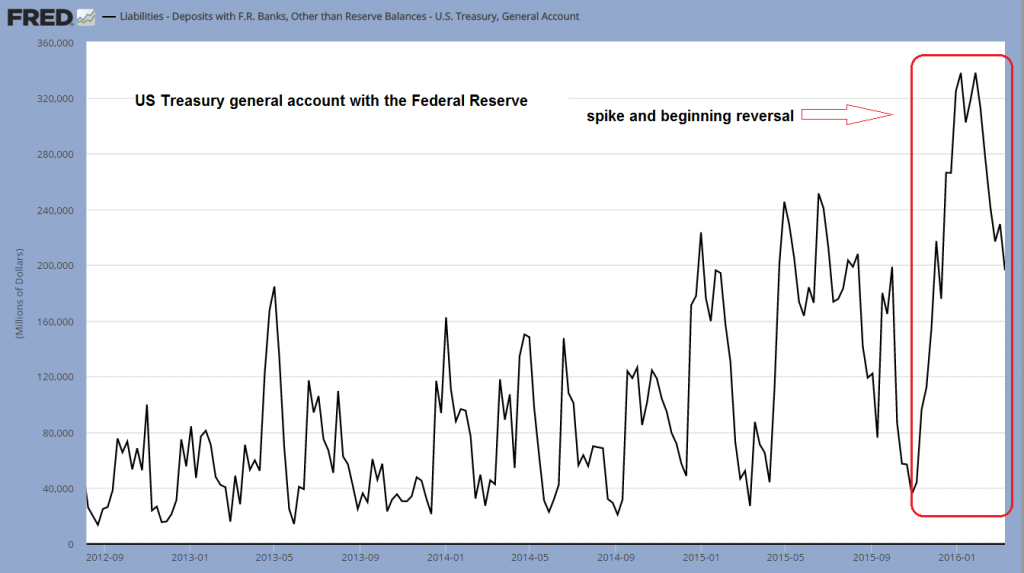
Money held in the treasury’s general account at the Fed – the recent record spike has begun to reverse – click to enlarge.
Readers not familiar with the method we employ in putting together the true money supply should take a look at this excellent summary and explanation by our friend Michael Pollaro, which contains numerous links to additional references (it will be time well spent). The basic principle is that we define money in line with the following suggestion penned by Murray Rothbard (in New Directions in Austrian Economics, pp-143-156, 1978):
“Money is the general medium of exchange, the thing that all other goods and services are traded for, the final payment for such goods on the market.”
This means that some things that are included in traditional money supply measures are left out, on account of the fact that they represent credit transactions rather than money, while others that are not part of the traditional aggregates are included because they clearly are money according to the above definition.
Demand deposit growth has spiked at year end to nearly 12% y/y, but then crashed to zero early in the new year and has since begun to recover again. This recovery should at least partly be due to the above mentioned shift. Note that demand deposits consist of both covered and uncovered money substitutes (i.e., fiduciary media); the currently very high level of excess reserves in the system means that the proportion of covered money substitutes has grown strongly since the 2008 crisis.
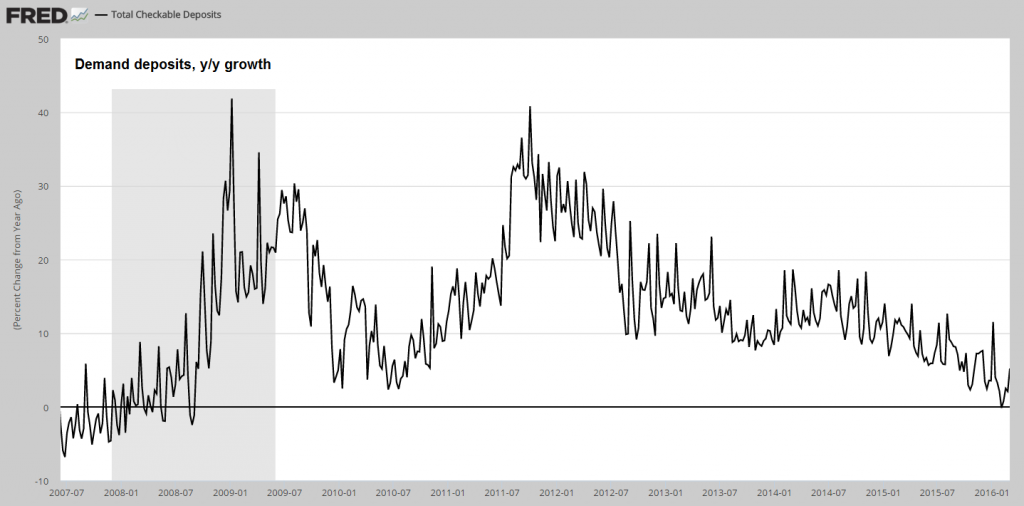
Demand deposits, y/y growth rate: after a brief spike at year-end, the overarching downtrend has essentially resumed – click to enlarge.
The important thing about the above chart is that the annualized growth rate of deposit money continues to be mired in a downtrend, which is reflected in the growth of narrow money supply aggregates as well. We are still using M1 as a proxy for the narrow money supply. This is not perfect, but it contains the most important components of TMS-1, namely currency and demand deposits (while the lone non-money component is so small as not to matter).


Leave A Comment