Over the last week we have used market sentiment indicators and index charts to gauge the prospects of finding a high on the post-September relief ‘bounce’ rally.
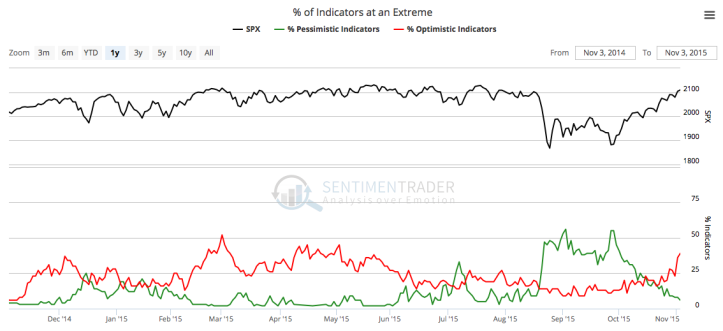
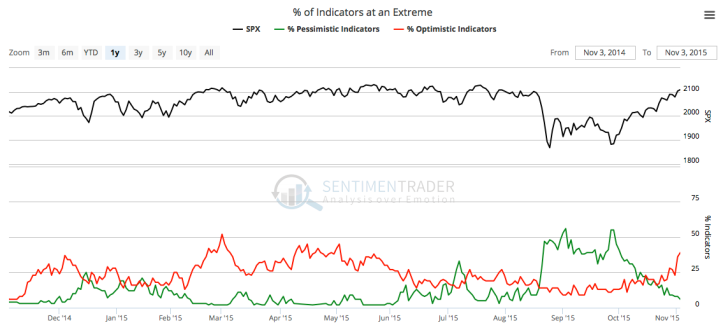
During August and September market sentiment had become brutally over bearish and this was very dangerous from the bears’ perspective. We set upside bounce targets for the SPX at 2020, 2040, 2060 and 2100. The first three were resistance levels (broken support) and the last was the general measurement of the ‘W’ bottom that formed in August and September. With the extremes in bearish sentiment, it was not so surprising that SPX climbed all the way to just above 2100.
Well, as we have noted in weekly reports and in-week updates recently, that problem for the bears was methodically eliminated by the rally as bulls’ backbones firmed up very well to the point of strenuous (though not hideously extreme) over bullishness. Here is one chart (courtesy Sentimentrader.com) among many sentiment graphics and data points we used in an NFTRH update on November 4. We had been watching pessimism dissipate quite nicely, but now the other component – rapidly growing optimism – was kicking in as well. This would pave the way for a correction from a sentiment standpoint.
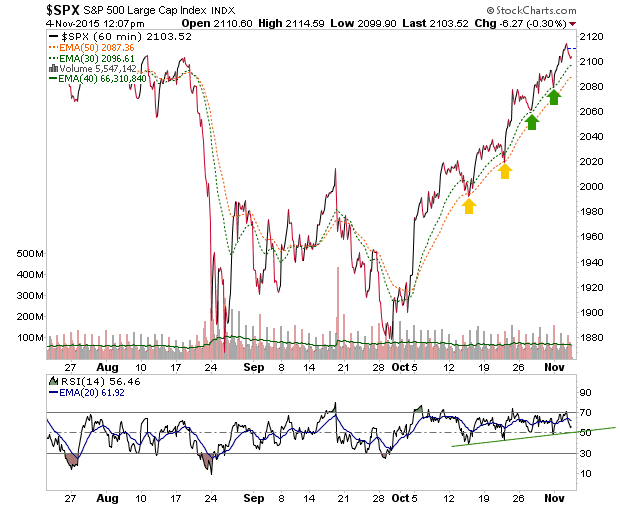
As a ‘look ahead’ we then used and continually updated this 60 minute chart of the SPX beginning with an update called What to Look for w/ Respect to the 1st Signs of a Market Breakdown in order to be prepared to view the very first inkling of what a correction might look like, now that sentiment was coming in line. The ensuing string of updates also included daily charts of SPX for viewing forward-looking support parameters in the event that the market did have an initial breakdown (per the 60 minute view).
The two 60 minute moving averages (EMA 30 & 50) had supported the entire post-September rally and as long as they were intact, there was no bear signal.


Leave A Comment