
Tomorrow brings a Bank of Canada rate decision, and this brings some light to what had been one of the strongest USD-trends in 2017. When the Bank of Canada hiked interest rates for the first time in over seven years in July, the Canadian Dollar drove on a spate of strength that lasted for the next two months. As we came into September, that really strong Canadian Dollar caught another gust of strength as the bank put in another rate hike, and a few days later we were sitting at fresh two-year lows in USD/CAD.
But since then we’ve seen sellers take over in CAD as USD/CAD has continued to run-higher in a rather consistent format, producing a bear flag formation as we look at in blue on the below chart.
USD/CAD Four-Hour: Bear Flag After September Post-Rate Hike Low
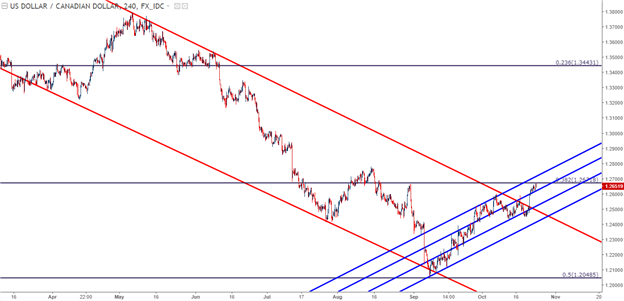
Chart prepared by James Stanley
At this stage, we’re seeing resistance show just a little ahead of a longer-term Fibonacci level, the 38.2% retracement of the 2014-2016 major move in the pair, and this comes after buyers had showed-up just ahead of the 50% Fib retracement of that same move earlier in September. This recent retracement has also included a break-above what was previously a key trend-line in the pair.
USD/CAD Weekly: Retracement Post-Rate Hike Breaks-Above Key Trend-Line
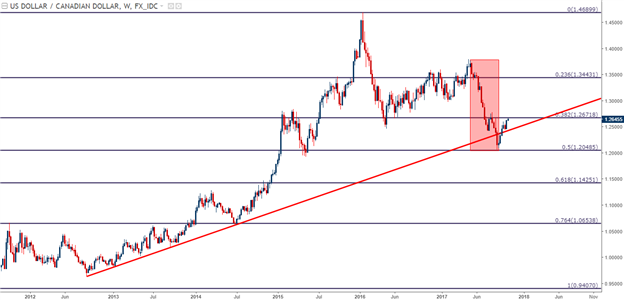
Chart prepared by James Stanley
The big question around USD/CAD is whether sellers come back or whether they’ll take a back seat as the bigger picture theme of USD-strength continues. On the four-hour chart below, we’ve applied three resistance levels above and four support levels below current price action so that traders can further evaluate this theme through tomorrow’s rate hike. If we do see an upward advance, traders can look for resistance to set-in at either of the three applied levels, at which point looking to the prior level for a pullback in the effort of catching ‘higher-low’ support.


Leave A Comment