
The USD/CAD pair attracted some buying on Thursday and stuck to its modest intraday gains, just below the 1.3700 round-figure mark through the first half of the European session.Crude Oil prices drift lower for the third successive day, which is seen undermining the commodity-linked Loonie. This, along with a further US Dollar (USD) recovery from its lowest level since September 1 touched in the aftermath of the softer US CPI report on Tuesday, turns out to be another factor acting as a tailwind for the USD/CAD pair.From a technical perspective, spot prices managed to defend the 50-day Simple Moving Average (SMA) support near the 1.3655 area on Wednesday and the subsequent move up favors bullish traders. That said, the lack of follow-through buying warrants caution before positioning for further gains amid bets that the Federal Reserve (Fed) is done hiking rates.Moreover, oscillators on the daily chart have just started gaining negative traction. Hence, a convincing break below the 50-day SMA support will be seen as a fresh trigger for bearish traders and pave the way for deeper losses. The USD/CAD pair might then slide to the monthly low, around the 1.3630-1.3625 region, en route to the 1.3600 round figure.On the flip side, a sustained strength beyond the 1.3710-1.3715 region could trigger an intraday short-covering move and lift spot prices to the next relevant hurdle near the 1.3750-1.3755 area. Any further move up, however, might still be seen as a selling opportunity and runs the risk of fizzling out rather quickly ahead of the 1.3800 round-figure mark.The latter should act as a key pivotal point, which if cleared decisively will shift the near-term bias back in favor of bullish traders. The USD/CAD pair might then accelerate the momentum towards the next relevant hurdle near the 1.3870-1.3875 region en route to the 1.3900 mark, or the highest level since May 2020 touched on earlier this month.
USD/CAD daily chart 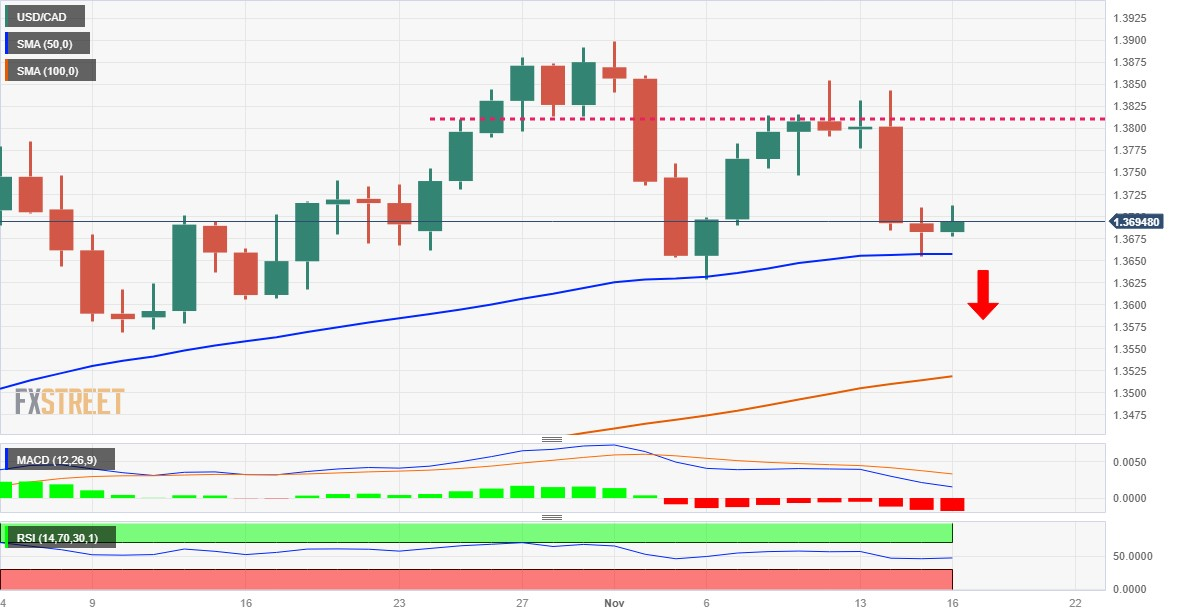
Technical levels to watch
USD/CAD
More By This Author:EUR/GBP Price Analysis: The Upside Barrier Is Seen At The 0.8750-55 Zone USD/JPY Trades With Modest Intraday Losses, Manages To Hold Above 151.00 Mark Gold Price Forecast: XAU/USD Consolidates Its Losses Around $1,960 On Higher US Bond Yields


Leave A Comment