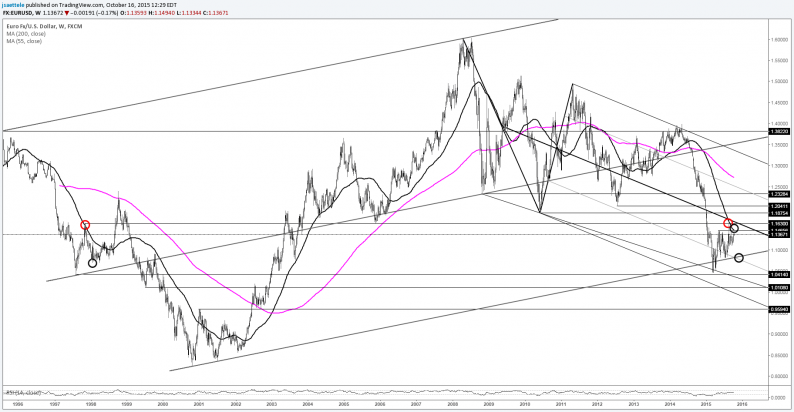
EUR/USD
Weekly
Click on image to enlarge
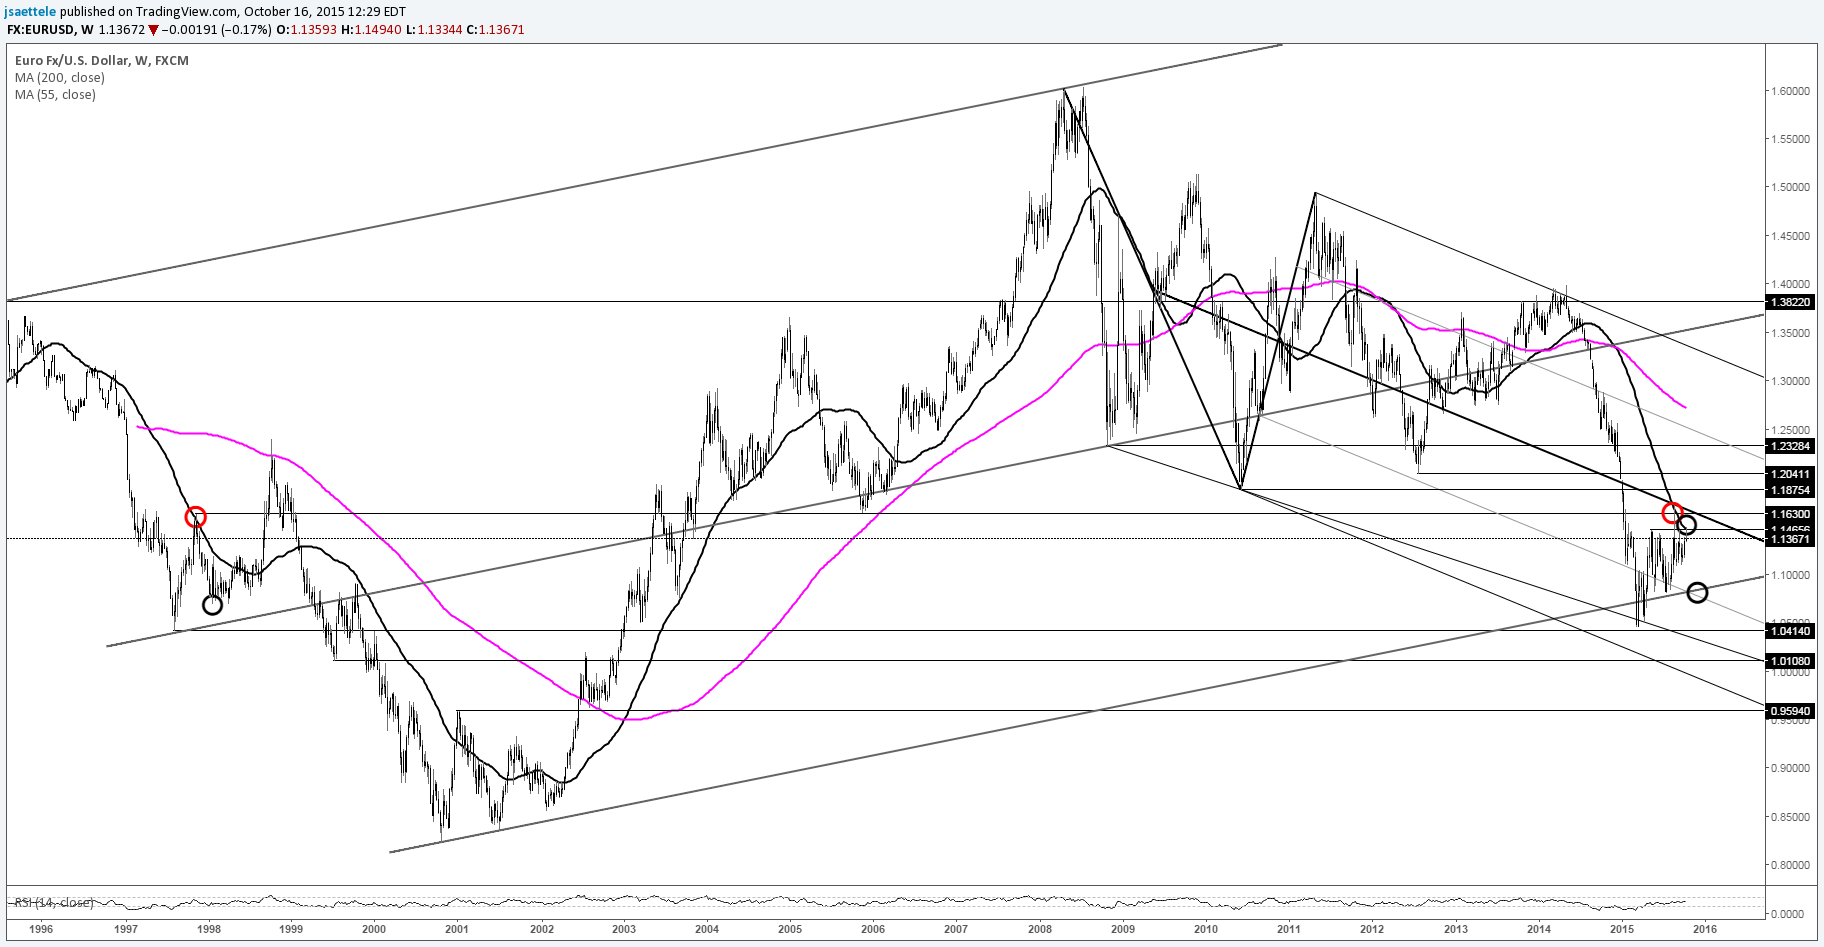
Chart Prepared by Jamie Saettele, CMT
Recent comments remain valid. That is, “Support is estimated in the mid-1.0800s. Resistance is estimated in the mid-1.1400s (May and June high are 1.1435/65). A break on either side would indicate potential for a larger move.” The high this week was a bit above the cited resistance but it did hold.
Big picture, EUR/USD has worked higher from long term support but failed again at the 55 week average this week. This is the same average that the rally failed at in August…and November 1997. The November 1997 parallel is interesting because that point marked the short covering rally from extreme weakness into the August 1997 low. In 2015, the same average (55 week) has repelled ‘short covering rallies’ following extreme weakness into the March 2015 low. Understand that every major turning point begins as a ‘short covering rally’. The question then is, ‘when does the short covering rally become a rally with legs?’ Well, if current behavior continues to follow that of 1997, then additional range trading is in store (that probably means back to the 1.0800s then higher again). Traction above 1.15 would suggest something bullish is underway.
GBP/USD
Weekly
Click on image to enlarge
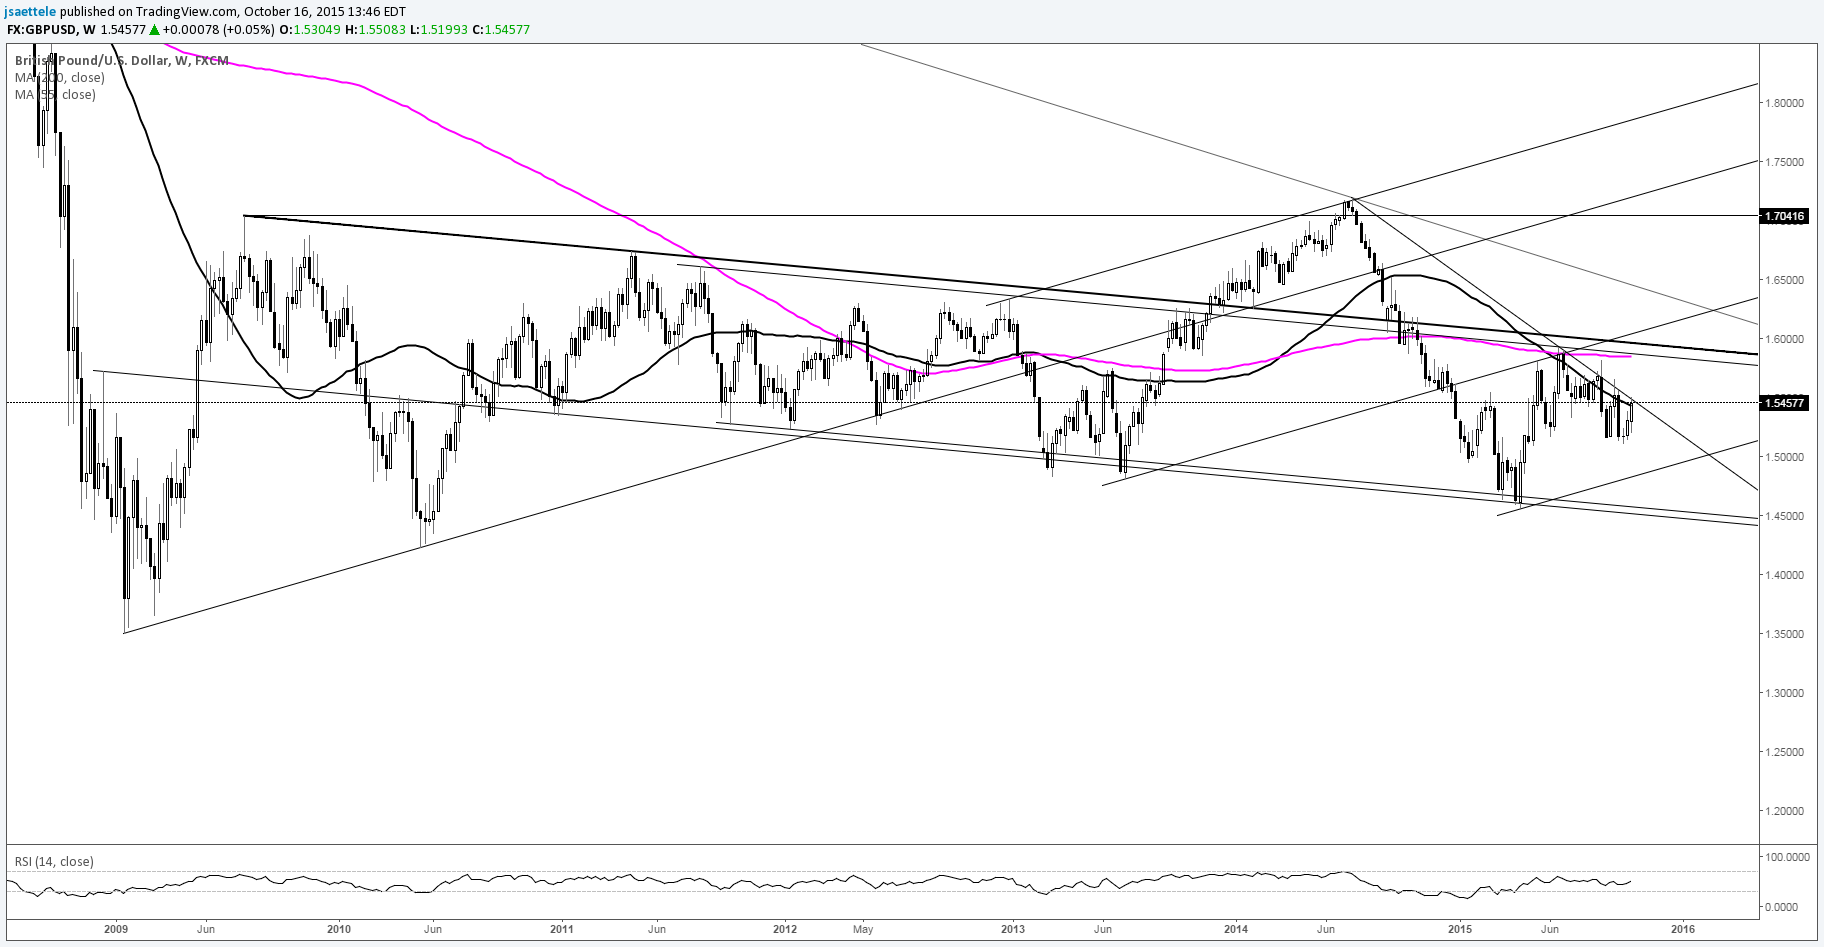
Chart Prepared by Jamie Saettele, CMT
It’s all about the line that extends off of the 2009 and 2011 highs. The long term picture in GBP/USD is bearish due to the behavior at this line and its associated parallels. The rate is at resistance now from the line that extends off of the 2014 and 2015 highs. A push above probably delays anything significantly bearish until near 1.60.
AUD/USD
Weekly
Click on image to enlarge
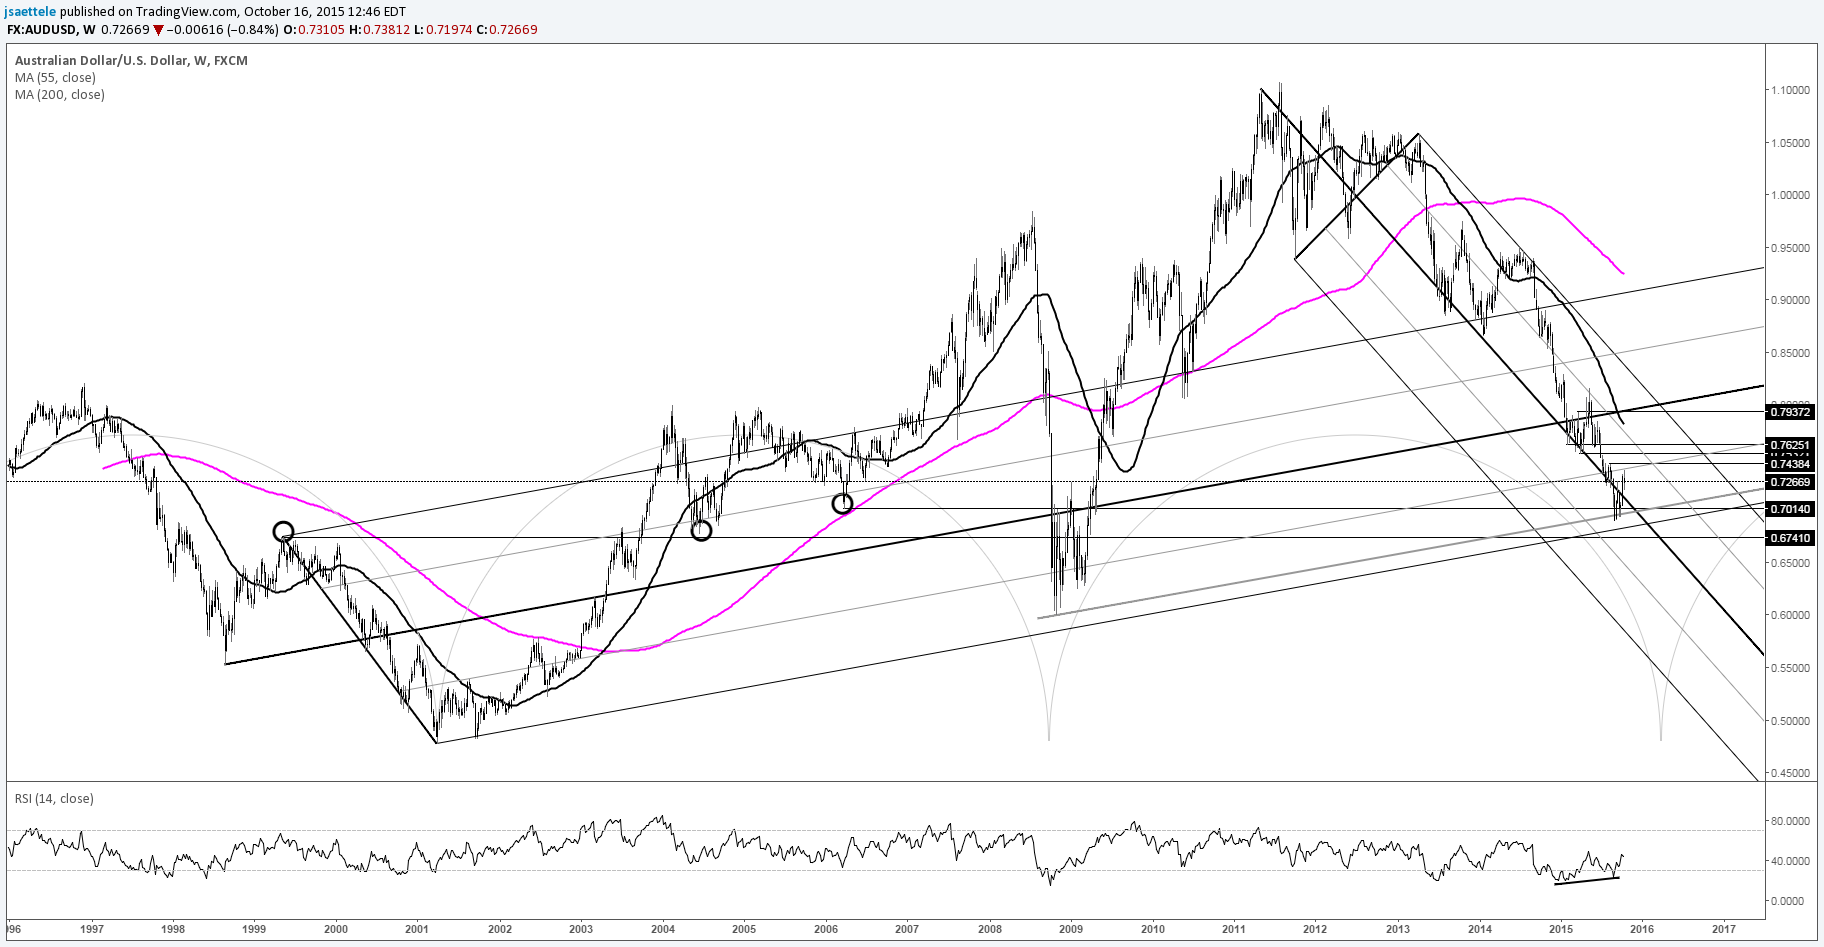
Chart Prepared by Jamie Saettele, CMT


Leave A Comment