
Ticker
Last
High
Low
Daily Change (pip)
Daily Range (pip)
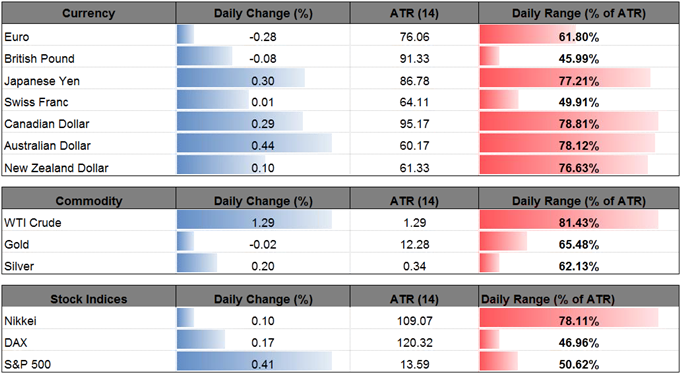
USD/JPY
111.73
112.23
111.56
34
67
USD/JPY stands at risk for further losses as it extends the series of lower-highs carried over from the previous week, while U.S. Treasury yields remain under pressure and give back the rebound from June.
With Fed Fund Futures still highlighting a 50/50 chance for a December rate-hike, it seems as though the recent remarks from Fed Chair Janet Yellen have tamed market expectations as the central bank head argues the benchmark interest rate ‘would not have to rise all that much further to get to a neutral policy stance.’ In turn, USD/JPY may exhibit a more bearish behavior over the near-term as the Federal Open Market Committee (FOMC) is expected to retain the current policy at the next rate decision on July 26.
At the same time, the Bank of Japan (BoJ) meeting may do little to shift the near-term outlook for the dollar-yen exchange rate as Governor Haruhiko Kuroda and Co. continue to embark on the Quantitative/Qualitative Easing (QQE) Program with Yield-Curve Control.
USD/JPY Daily
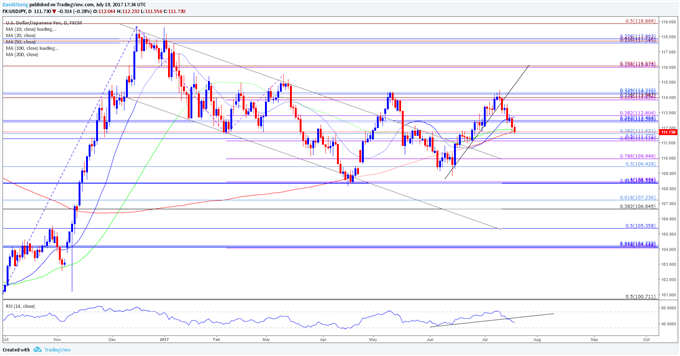
Chart – Created Using Trading View


Leave A Comment