
Commodity Channel Index (CCI)
The Commodity Channel Index indicator (often abbreviated as ‘CCI’) is a technical analysis indicator introduced by Donald Lambert in 1980. As an oscillator, it was created as — and still lends itself to — indentifying instances where a stock or index is overbought or oversold. But, as is the case with many technical analysis tools, the Commodity Channel Index indicator has been refined and interpreted in a variety of unconventional but still highly effective ways.
The answer the common question “Why is it a ‘commodity”‘ channel index?’, Lambert was a commodity trader, and developed the indicator as a means to find cyclical turning points for commodity prices. The tool, though, has been practically applied to stocks and market indices.
The CCI indicator — a single-line tool plotted on a scale of -100 to +100 — plots the difference between a stock’s price change for any given bar and its average price change (per bar) over the course of a specified timeframe. The indicator formula is:
CCI = (((High + Low + Close)/3) – X-period SMA of ((High + Low + Close)/3)) / (.015* x Mean Deviation)
* In this case, the ‘0.15’ value is the chosen “constant” preferred by Lambert, though this can be adjusted as needed.
High readings (above +100) of the commodity channel index say prices for that instrument are above their norm thanks to abnormally large gains for recent bars, indicating strength. Conversely, low readings (below -100) of the commodity channel index say recent weakness has been uncharacteristically weak, suggesting extreme bearishness.
That’s where the interpretation of the CCI indicator can become tricky, and nuanced.
As a mathematical oscillator that is designed to spot instances where a security is overbought or oversold, the logical interpretation of the CCI tool would be to sell when readings are above +100 or buy when readings are below -100. But, careful study of the indicator’s history reveals that a stock or index that’s overbought can stay overbought and rally indefinitely. Likewise, an oversold security can remain oversold indefinitely, with that stock or index continuing to move lower the whole time.
In that light, the commodity channel index can also serve as a momentum indicator. As always, interpretation and application are subjective, and in this particular case may be best used in conjunction with other indicators.
Some traders also use crosses above the zero line as a buy or sell signal, as it would suggest a new trend is in development.
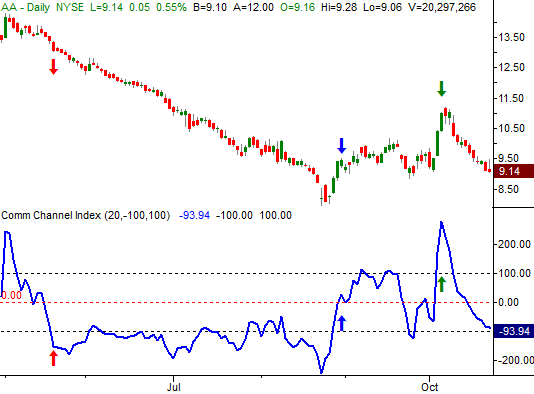
The example below illustrates how the CCI tool could have been used with Alcoa (AA); each noteworthy signal is marked with an arrow. Once the CCI indicator broke below -100, a prolonged downtrend ensued, confirming commodity channel index can indeed identify momentum. Later on, when the CCI line broke above the zero level, that signal could have prompted an exit of the bearish trade and/or cued a new bullish trade. After that, when the commodity channel index surged well above +100, it was indeed an indication that Alcoa shares were overbought, and a pullback soon followed.
AA Daily Chart with CCI
Though it requires a certain degree of interpretation and “feel” to use it, CCI can be a potent addition to a trader’s arsenal.


Leave A Comment