
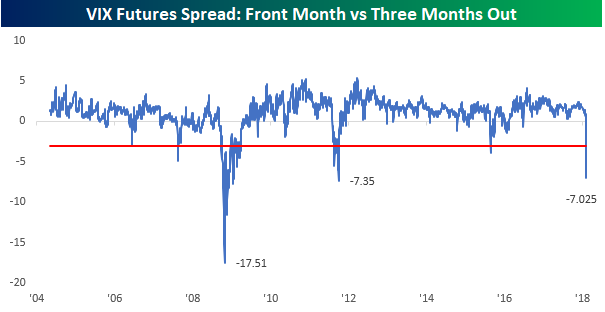
With all of the stress in the volatility markets over the last 24 hours, pricing in the VIX futures curve has really gotten wacky. While spot VIX surged from under 20 to just about 50, the spikes in VIX futures were more contained (on a relative basis at least). For example, the front month VIX futures contract didn’t even get above 30 in the last 24 hours while the futures contract three months out didn’t even get above 25. The chart below shows spread between the front-month and three-month VIX futures contracts going back to 2004. As of yesterday’s close, the spread between the two contracts was over 7 handles indicating that the contract maturing in three months was trading 7 points lower than the front month future.
This wide of a disparity, which is called backwardation, is incredibly uncommon in the VIX futures curve. Since 2004, there have only been two other periods where the spread between the two contracts was wider to the downside and those were during the financial crisis and when the US lost its AAA credit rating in 2011. Those were two periods of major market stress! Additionally, there have only been a handful of other occurrences where the three-month VIX futures contract was trading cheaper than the front-month contract. Two of those occurrences were in 2007, and the other was in the summer of 2015 when China devalued the yuan.
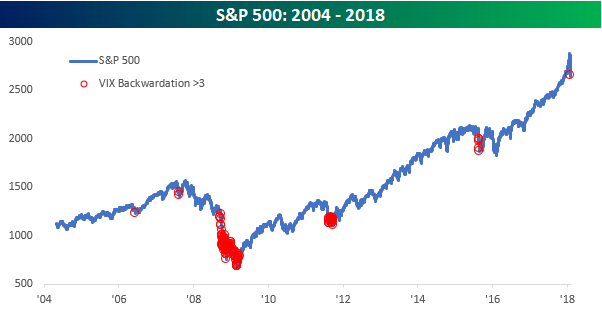
The chart below of the S&P 500 shows every day since 2004 where the three-month VIX futures contract traded more than three points cheaper than the front-month contract. Looking back at each of those prior periods, all but one proved to be a decent buying opportunity (late 2007) for anyone willing to hang in for a bit.


Leave A Comment