It’s only Tuesday, but what a week it’s been thus far in the equity markets…
Volatility Crashes
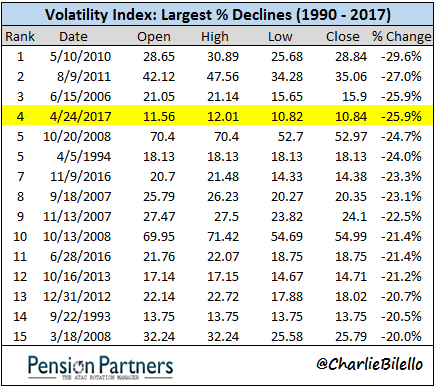
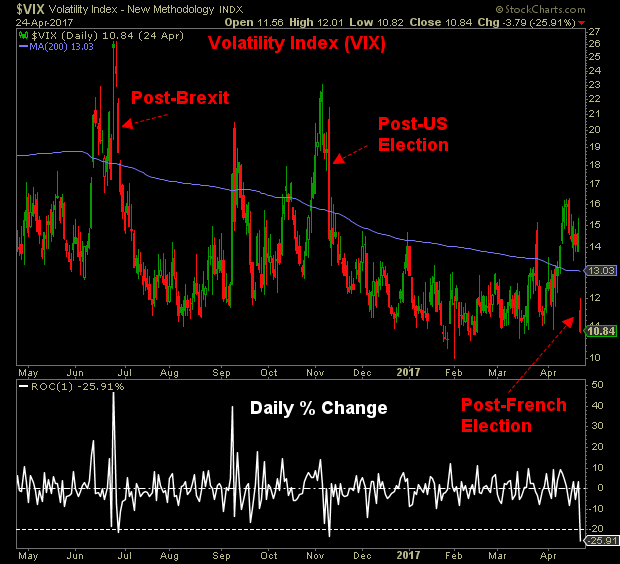
On Monday we saw the 4th largest decline in history for the Volatility Index (VIX), a 25.9% drop. This crash in volatility may sound familiar as #7 (post-election, 11/9/16) and #11 (post-Brexit. 6/28/16) also occurred within the last year.

With increasing frequency, it seems, expectations of higher volatility in the options market due to some perceived negative event (this time: the French elections) do not pan out.
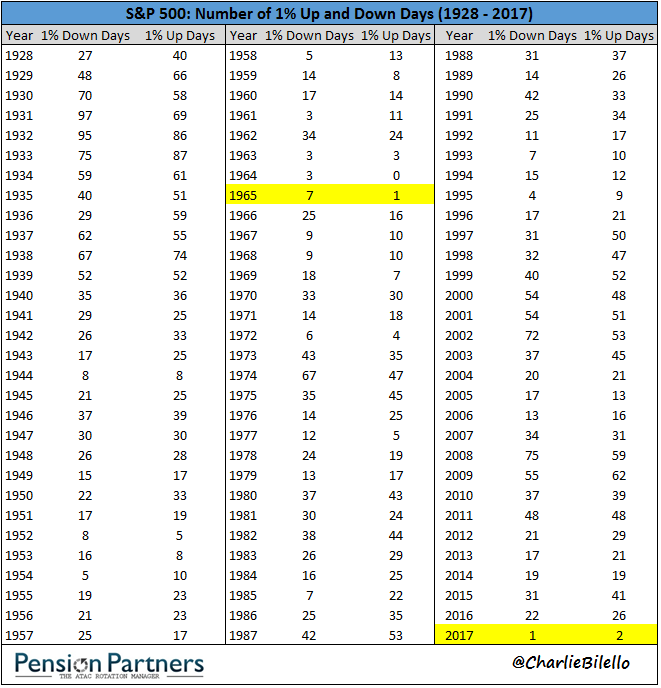
Speaking of volatility, on Monday the S&P 500 finished up over 1%, which is not notable at all except for the fact that it was only the third time in 2017 we have seen a 1% move. If that pace continues, 2017 would be the lowest volatility year since 1965.
New Tech Highs
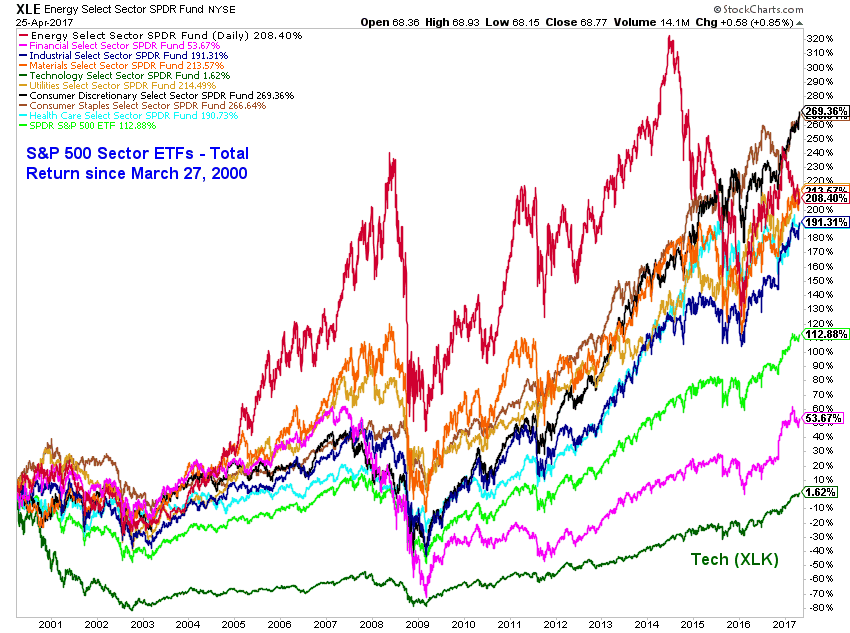
Not to be outdone, we saw something on Monday that we haven’t seen in 17 years – a new all-time high in Tech stocks. The Tech sector (XLK ETF) peaked back on March 27, 2000 and at long last has surpassed that level (note: total return including dividends). The lesson here: valuation matters very much at extremes. An absurdly overvalued asset can take a long, long time to “get back to even” after a bubble top. Japanese equity investors from 1989 are still waiting.
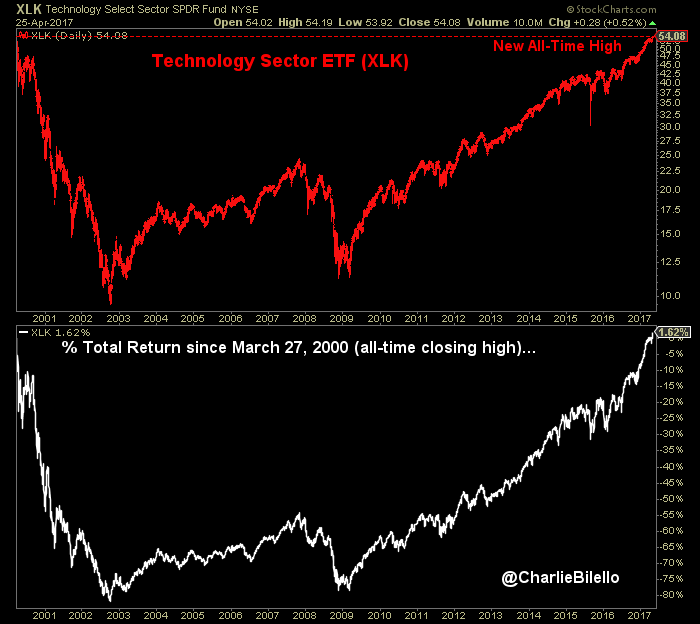
The best protection against a bubble/crash in a single asset class or sector: diversification.
2000 Vs. 2017
Finally, the Nasdaq Composite hit 6,000 today, 17 years after hitting the 5,000 milestone. Some are comparing today’s market to back then but when you look closer there is really no comparison. From July 1995 through March 2000, the Nasdaq Composite quintupled (+400%), going from 1,000 to 5,000. Then it crashed and would take 17 years to move 20% above the March 2000 level.


Leave A Comment