

As we conclude week two of the new Presidential cycle, it certainly has not been dull.
The markets have started struggling with an Administration which is hanging up on heads of state, threatening to send troops to Mexico, discussing border taxes and thinking about doubling the required wages for HB-1 visas. Of course, those issues are still currently offset by hopes for a sea of infrastructure spending, tax cuts and reform and an increase in jobs and wages.
The “hope” is most clearly seen in the sentiment surveys, but remains elusive in the “hard data.” As noted recently by Charlie McElligott via RBC:
“The US data has been running at such a clip, as a matter of fact, it’s an increasingly (and massively rhetorical) popular question asked by clients: when do analyst / strategist expectations begin to overshoot?
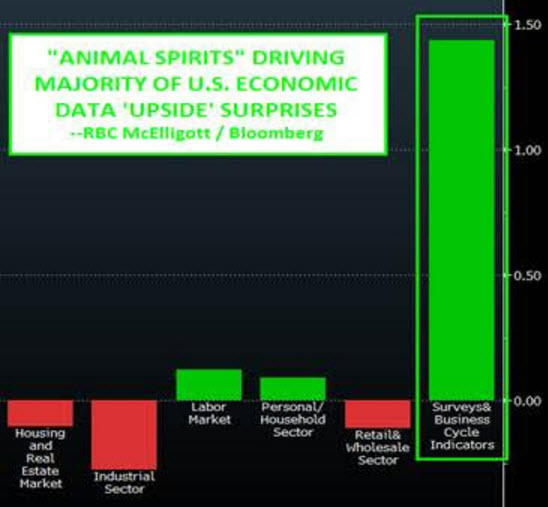
Tied-into this, the Bloomberg ‘econ surprise’ series gives an interesting breakout of the drivers of the directional data surprises, and it crystalizes one ‘area’ that Mark Orlsey and I have been paying a lot of attention to with regards to where the largest ‘beats’ are coming from.
The economic surveys and ‘animal spirits’ indicators have been ‘en fuego’ (see Friday’s U Mich Confidence printing highs since 2003!), and the chart below captures just how much of the ‘surprise index’ upside that surveys have been dictating – it’s visually stunning, and reiterates that ‘rubber needs to meet road’ in coming months.“
We can see this more real time by looking at the Chicago Fed National Activity Index (CFNAI) which is arguably one of the more important economic indicators. The index is a composite made up of 85 subcomponents which give a broad overview of overall economic activity in the U.S. However, unlike backward-looking statistics like GDP, the CFNAI is a forward-looking metric that gives some indication of how the economy is likely to look in the coming months.Importantly, understanding the message the index is designed to deliver is critical. From the Chicago Fed website:


Leave A Comment