
HIGHLIGHTS:
DOW JONES INDUSTRIALS (DJI)
(This analysis is a follow-up to the identification of 25,000 as the next major resistance area in our September 25, 2017 article.)
The Dow’s triumphant rise to 25,000, which was reached last week, marks the next phase of activity, as per this enhanced and updated chart outlining master support and resistance:
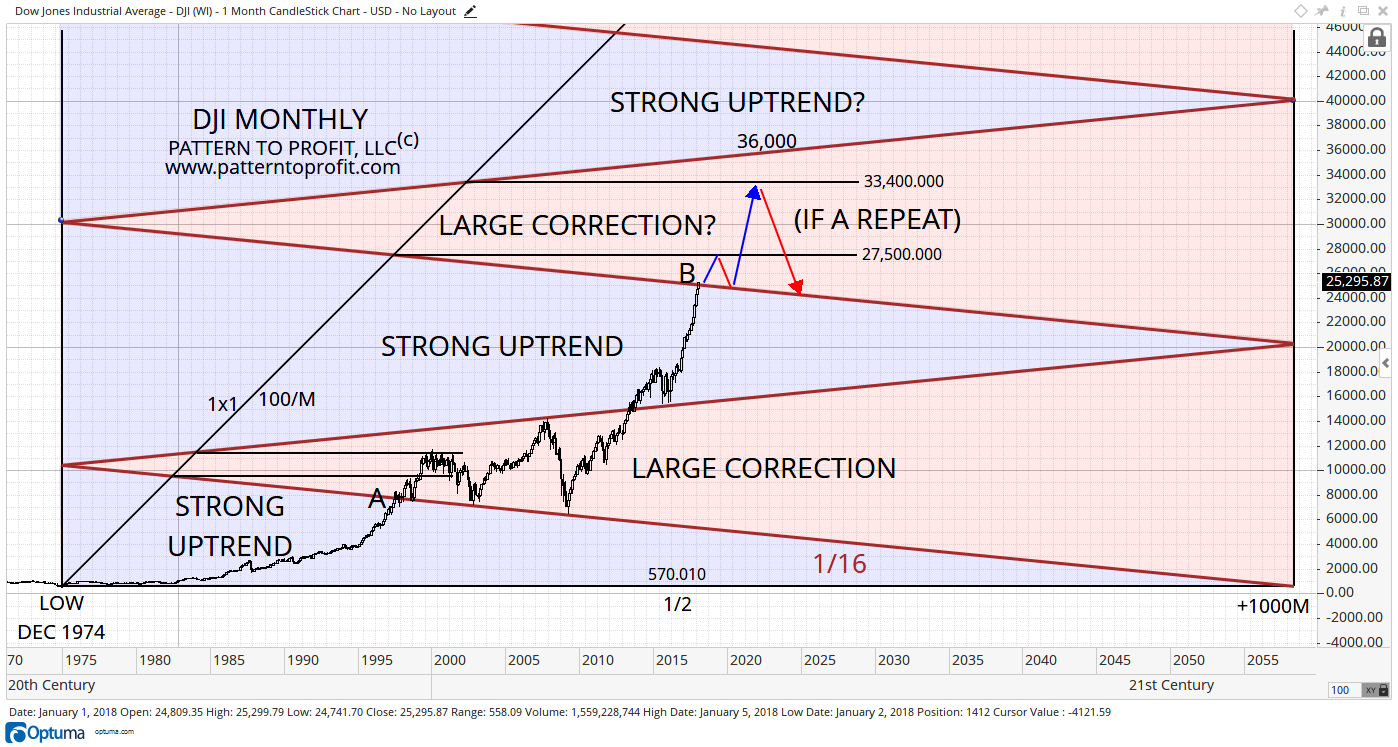
Note the dramatic difference in market movement between the blue and red shaded areas.
Just as it did previously at point A, the Dow is now entering the next large correction area (point B), invoking concerns of an eventual large bear market. However, it has quite a way to go before the upper levels of this area become a realistic concern (33,400 to 36,000).
The prior price movement from point A to the tops of 1998 and 2000 and their respective drops back down to support are carried forward to the current market (blue and red lines/arrows). A perfect repeat would yield the indicated movements.
Naturally, if the market does not maintain prices above 25,000, support is expected at prior resistance of 22,400, as discussed in the September 2017 article.
Keeping in mind that 27,500 is the next higher resistance level, we move on to an entirely different analysis approach, yet yielding eerily similar results. By using square numbers x1000 as support and resistance levels (more importantly, the space between the levels, as divided fractionally) a major market movement seems to be repeating here as well:
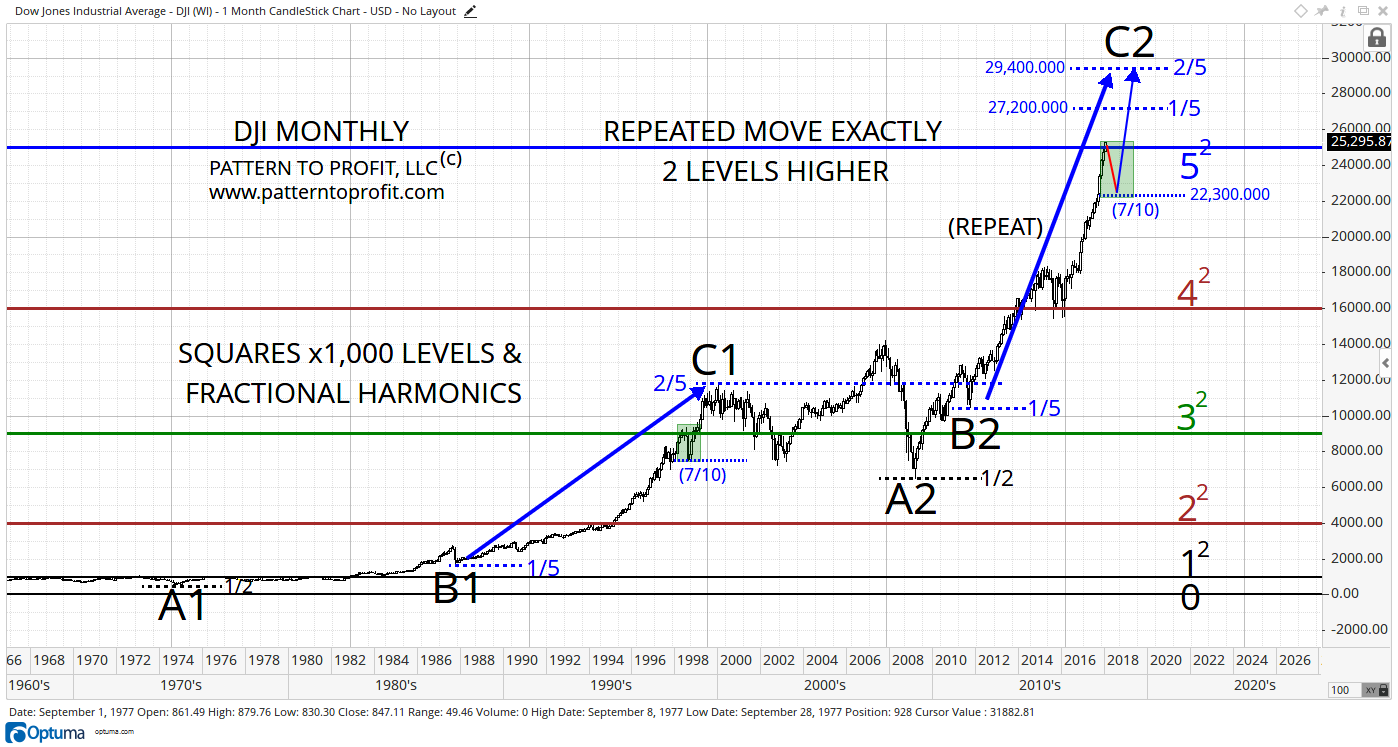
The relationship of major lows of March 2009 at 6,469.95 (A2) and October 2011 at 10,404.49 (B2) are a perfect repeat of the two proceeding important lows of December 1974 at 570.01 (A1) and October 1998 at 1,616.20 (B1). These two sets of lows occur at a 1/2 level followed by a 1/5 level in the next range, but are two full ranges apart from each other.


Leave A Comment