
In this series we scale-back and take a look at the broader technical picture to gain a bit more perspective on where we are in trend. Here are the key levels that matter on the weekly charts heading into the holiday weekend.
DXY WEEKLY PRICE CHART
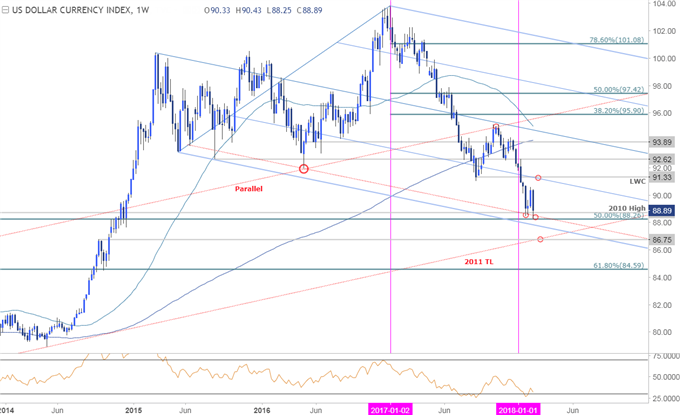
Notes: Last month we highlighted a key support zone in the Dollar Index, “at 88.26/71 where the 2010 swing high converges on the 50% retracement of the 2011 advance. Note that basic downslope support also converges on this region and further highlights the near-term risk to the broader downtrend.” Indeed price has continued to trade above this threshold for the past three weeks with the index once again testing this support on Friday.
Bottom Line: The focus remains on a below this level with the broader outlook still weighted to the downside while below the 2017 low-week close at 91.33. A break targets the 2011 trendline support which converges on the 2014 September swing high at ~86.75 (an area of interest for possible exhaustion / long-entries).
USD/JPY WEEKLY PRICE CHART
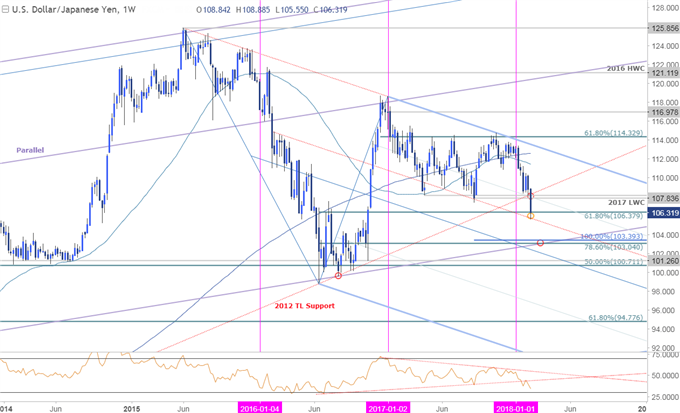
Notes: USD/JPY broke below confluence support at 107.84 this week with prices now probing the 61.8% retracement of the 2016 advance at 106.38. Note that a sliding parallel of the dominant slope (red) caught the lows today and may offer a reprieve near-term.
Bottom line: From a trading standpoint, this support zone could interrupt things a bit but look to fade strength sub-107.84 with a break lower targeting confluence support at 103.04/40 where the 100% extension and the 78.6% retracement converge on broader slope support (critical).
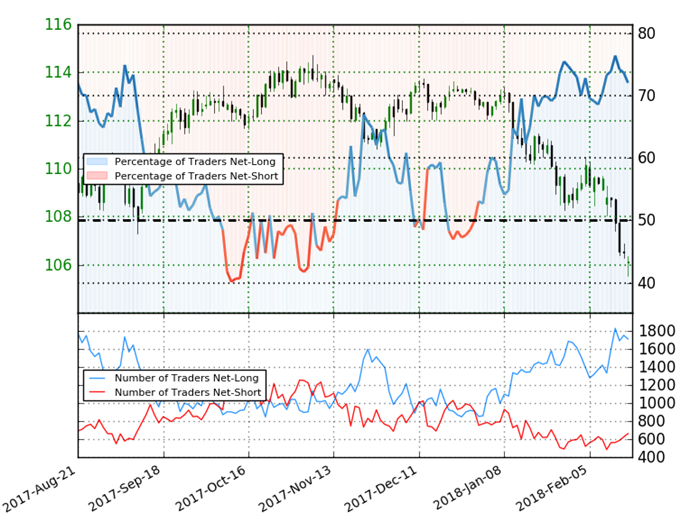
USD/JPY IG CLIENT POSITIONING


Leave A Comment