
In this series, we scale-back and take a look at the broader technical picture to gain a bit more perspective on where we are in trend. Gold is down nearly 13% from the yearly highs with price trading just above long-term structural support heading into the close of the third quarter. Here are the key targets & invalidation levels that matter on the Gold (XAU/USD) weekly chart.
GOLD WEEKLY PRICE CHART
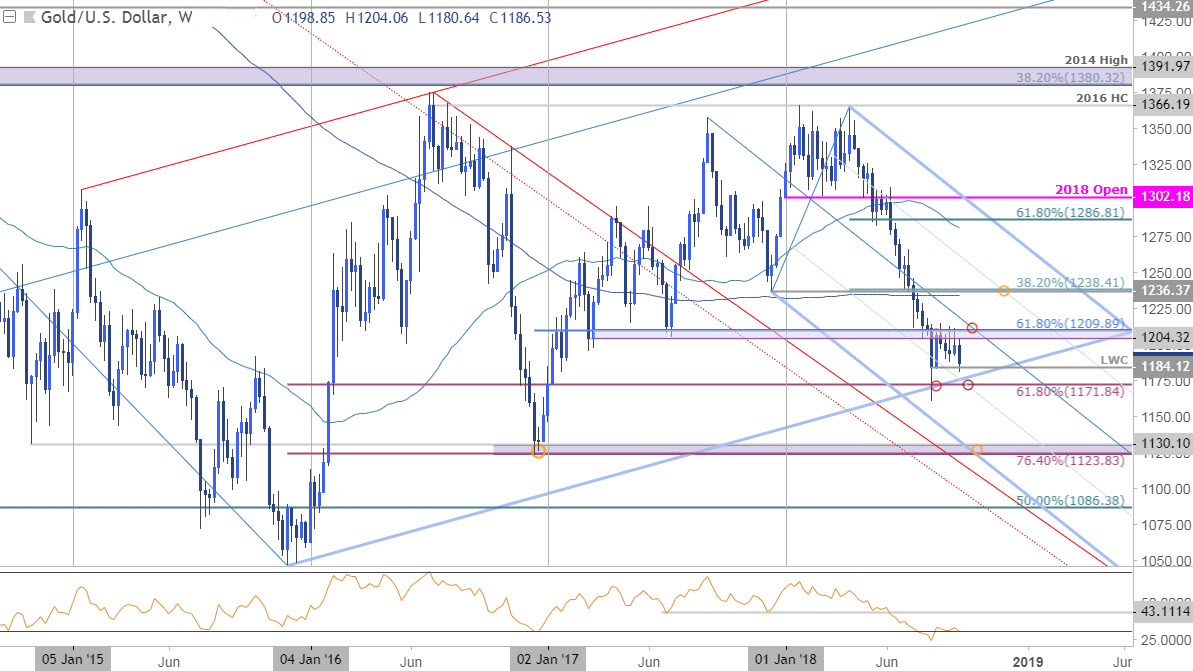
Notes: In Last week’s Gold Price Outlook, we highlighted a month-long consolidation pattern in XAU/USD and heading into this week’s FOMC interest rate decision, our focus was on a breakout of this formation. A surge in the US Dollar post-Fed fueled further losses in bullion with price breaking below triangle support & the monthly opening-range yesterday.
The decline is testing initial support at the 2018 low-week close at 1184 with a more significant confluence region just lower at 1172. This level is defined by the 61.8% retracement of the entire late-2015 advance and converges on the 50-line of the descending pitchfork formation we’ve been tracking off the 2017 & 2018 highs.
A break below this threshold would be needed to mark the resumption of the broader downtrend – note that this would necessitate a break below broader pitchfork support (blue) with such a scenario exposing subsequent objectives at 1124/30. Initial resistance stands at 1204 with a breach above the 61.8% extension / median-line at 1210 needed to shift the focus back towards confluence resistance at 1236/38.
Bottom line: Heading into the start of October trade, Gold prices will need to hold above support at 1171 IFthe broader 2015 uptrend is to remain viable. From a trading standpoint, I’ll be looking for evidence of an exhaustion low early next month to offer more favorable long-entries while above multi-year structural support. Ultimately a weekly close above 1210 would be needed to suggest that a more significant low is in place.


Leave A Comment