Stocks once again made a sharp turnaround late in Wednesday’s session. The “mystery” rebound took the S&P 500 (SPY) up 3.5% in about two days of trading. Despite the important economic releases and heavy earnings calendar next week, expect the punditry to be asking:
Is the correction over?
Prior Theme Recap
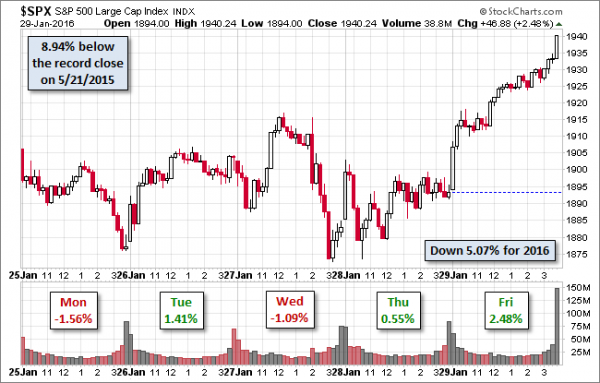
In my last WTWA I predicted that everyone would be watching for a dovish tilt from the Fed. That was certainly the big story for the first part of the week, including several programs that used the “dovish tilt” phrase. Even after the Fed meeting, speculation about the “real meaning” of the FOMC statement remained newsworthy. The initial reaction was that the message was indeed a dovish tilt. The brief rally quickly turned negative. By day’s end the agreed theme was that the Fed had not gone far enough. Or maybe was signaling weakness. Or maybe they were confused. You can see the turnaround in stocks from Doug Short’s weekly chart. (With the ever-increasing effects from foreign markets, you should also add Doug’s weekly chart to your reading list).

Doug’s update also provides multi-year context. See his weekly chart for more excellent charts and analysis.
We would all like to know the direction of the market in advance. Good luck with that! Second best is planning what to look for and how to react. That is the purpose of considering possible themes for the week ahead. You can make your own predictions in the comments.
This Week’s Theme
There is a big economic calendar this week, featuring the employment report on Friday. There is also a continuing flow of major earnings reports. Despite this I expect the debate over last week’s market action to remain at center stage. Everyone will be wondering –
Is the correction over?
Since the decline from the market peak is now below 10%, the market is out of correction territory. Since there is so much disagreement about what brought the rebound, no one really knows if the improvement in stocks will stick.
Listed below are popular arguments from Thursday and Friday. I expect support for each as we try to interpret the big week of news.
As always, I have my own opinion in the conclusion. But first, let us do our regular update of the last week’s news and data. Readers, especially those new to this series, will benefit from reading the background information.
Last Week’s Data
Each week I break down events into good and bad. Often there is “ugly” and on rare occasion something really good. My working definition of “good” has two components:
The Good
On balance the news was pretty good last week.
The Bad
Some of the economic data was disappointing.


Leave A Comment