
Once again, the economic calendar is fairly light. Vacations continue for many. The upcoming Labor Day weekend will tempt many market participants to end this week early. Financial news seems more like political news these days. Much of the punditry is focused on a death watch for the bull market, with daily discuss of the flattening yield curve and speculation about when it will “invert.” This is not the right question. Pundits should be asking: Should investors be worried about the yield curve?
Last Week Recap
In my last edition of WTWA I previewed the annual Fed Jackson Hole symposium. I provided the material for your own party bingo card on what to expect from the punditry. Many of the suggestions were covered early in the week and all of them by Friday. I noted that many would leave after the release of Powell’s speech. The chart for the week (below), shows a flat line for the rest of the day.
Finally, and most importantly, the news continues to be framed in terms of when the bull market will end and what will cause it. How different it would be if experts were asked about the key market drivers and whether they were still working. As always, Alan Steel’s commentary is clever, humorous, and accurate. Here is a tidbit:
Some two-thirds remain neutral to bearish by the American Association of Individual Investors’ (AAII) reckoning – unwilling to leave the March 2009 dour sentiment party gathering of anoraks, recessionistas, safety-seekers and economists (does that spell ‘arse’?).
Millions stand steadfast in that nine-year-long line, taking in turn their opportunity to swing the Trump, Turkey and trade war baton at the stock market pinata; a torn and battered beast yet stuffed and sturdied with stable economic indicators despite the unyielding headline assaults.
The Fear and Greed Trader also notes the deceptive framing of issues:
Not a week goes by when someone doesn’t appear and make one or both of these comments. “We are late in the cycle” and “stocks are expensive”. The statements are made as a matter of fact and no one seems to challenge them.
The Story in One Chart
I always start my personal review of the week by looking at a great chart. I especially like the version updated each week by Jill Mislinski. She includes a lot of valuable information in a single visual. The full post has even more charts and analysis, including commentary on volume. Check it out.
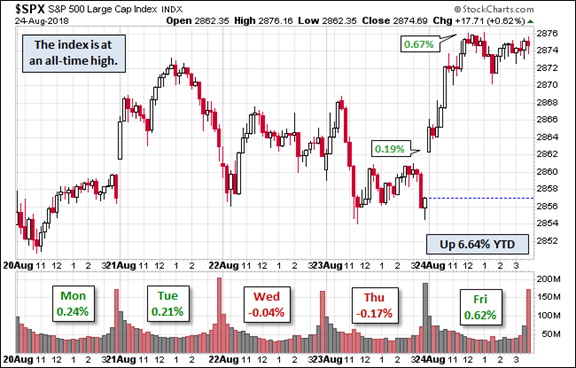
The market gained 0.88% on the week and has reached a new all-time high. The chart reflects variation, but the scale is one again a narrow one. The weekly trading range was less than 1%. I summarize actual and implied volatility each week in our Indicator Snapshot section below. Volatility remains well below the long-term range.
The News
Each week I break down events into good and bad. For our purposes, “good” has two components. The news must be market friendly and better than expectations. I avoid using my personal preferences in evaluating news – and you should, too.
When relevant, I include expectations (E) and the prior reading (P).
The Good

The Bad


Leave A Comment