We have the biggest data calendar of the year, climaxing with the employment report. It is right before the Labor Day weekend. It is a natural setup for politicians and pundits alike. Expect many to be asking:
How Can We Create More Jobs and Better Pay?
Last Week Recap
My expectation that last week would focus on the state of the economic policy agenda was pretty accurate. While the overall weekly change in the market was modest, the moves came from an evaluation of the agenda potential. Monday saw an expectation of more Congressional cooperation. Tuesday night’s campaign-style speech brought fears of a government shutdown. The economic announcements, while pretty good, seemed to have little effect on trading.
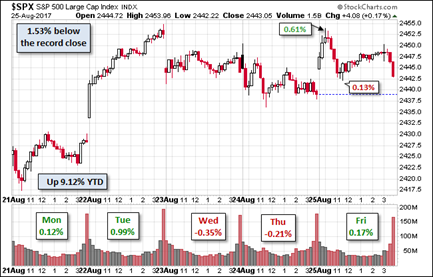
The Story in One Chart
I always start my personal review of the week by looking at this great chart from Doug Short via Jill Mislinski. She notes the overall weekly gain of 0.73% as well as the relationship to the record close and the daily action. The only thing missing? Highlights noting the tweet of the day.

Doug has a special knack for pulling together all the relevant information. His charts save more than a thousand words! Read the entire post for several more charts providing long-term perspective, including the size and frequency of drawdowns.
The Silver Bullet
As I indicated recently I am moving the Silver Bullet award to a standalone feature, rather than an item in WTWA. I hope that readers and past winners, listed here, will help me in giving special recognition to those who help to keep data honest. As always, nominations are welcome!
The News
Each week I break down events into good and bad. For our purposes, “good” has two components. The news must be market friendly and better than expectations. I avoid using my personal preferences in evaluating news – and you should, too.
The economic news last week was generally positive. Even those that missed expectations were not too bad.
The Good

- S&P 500 forward revenues per share, which tends to be a weekly coincident indicator of actual earnings, continued its linear ascent into record-high territory through the week of August 10.
- S&P 500 forward operating earnings per share, which works well as a 52-week leading indicator of four-quarter-trailing operating earnings, has gone vertical since March 2016. It works great during economic expansions, but terribly during recessions. If there is no recession in sight, then the prediction of this indicator is that four-quarter-trailing earnings per share is heading from $126 currently (through Q2) to $140 over the next four quarters.
The Bad


Leave A Comment