“How did the stock market do today?”
At surface, this seems like a simple question – but it’s also deceptively difficult to answer. The market can be defined as many different things, and there are actually over 100,000 publicly traded companies in the world to choose from.
Luckily, the use of a stock market index can help define a particular market, as well as track its performance in a way that is easy to reference.
TYPES OF INDICES
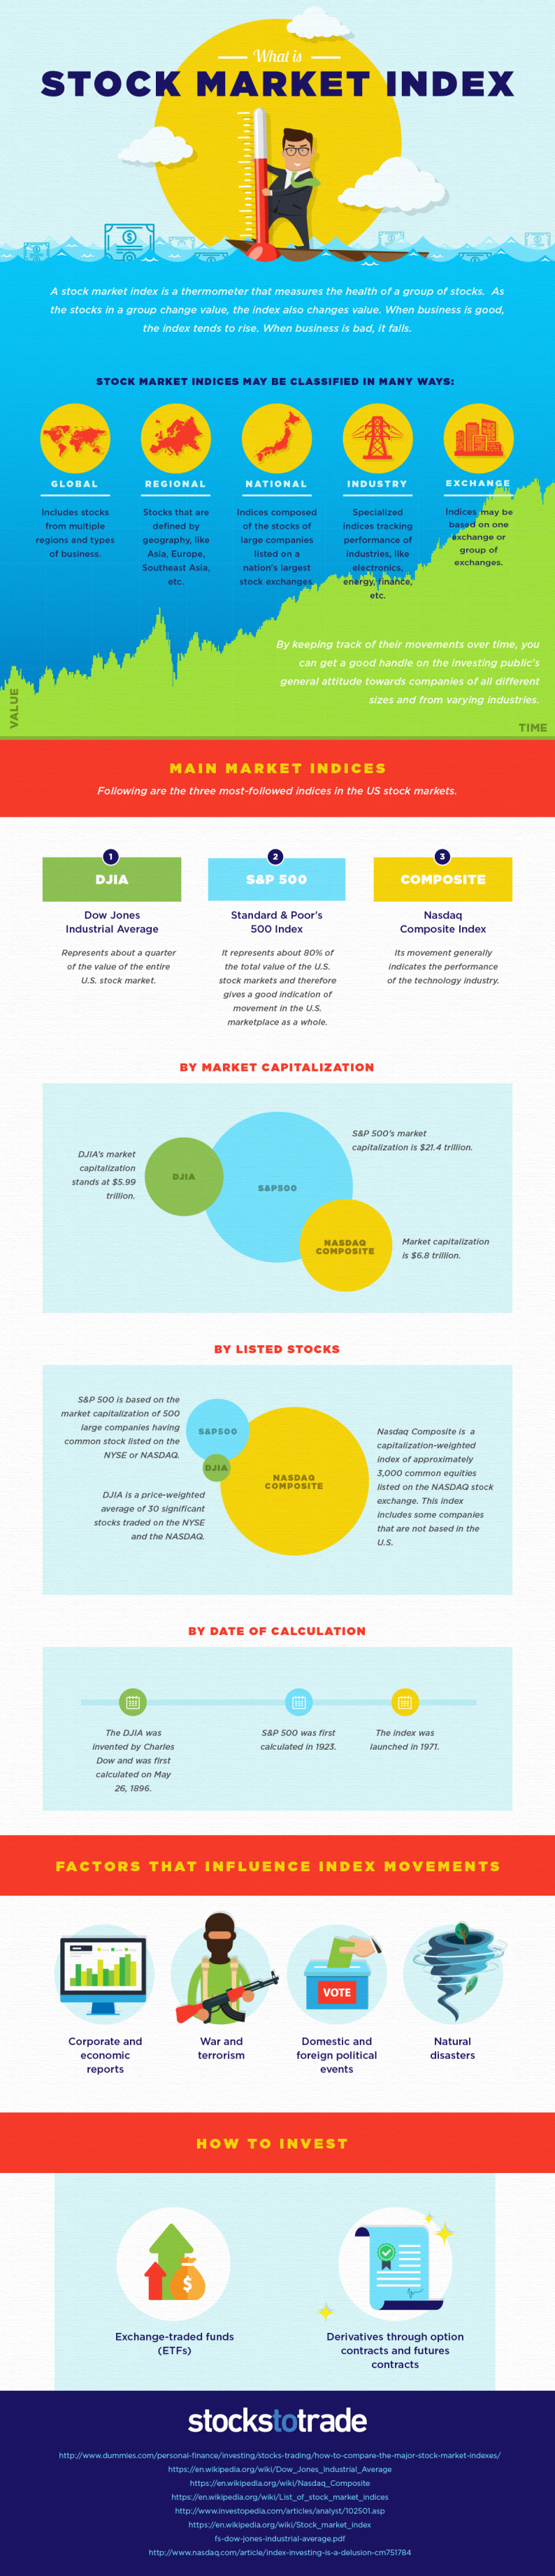
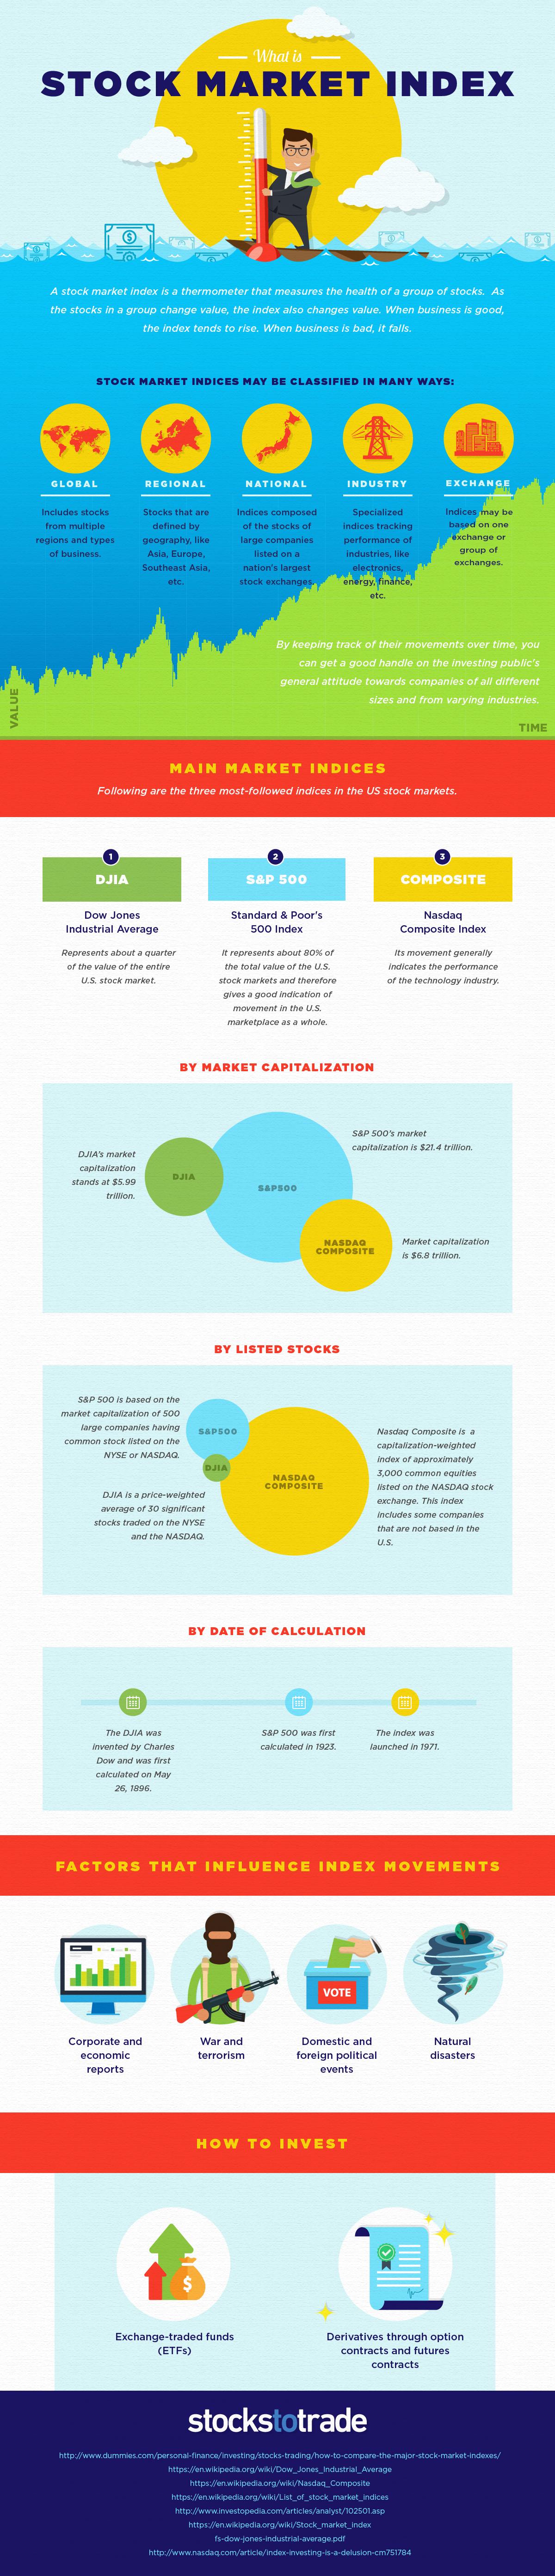
Today’s infographic from StocksToTrade.com defines a stock market index as a thermometer that measures the health of a group of stocks. When this particular group of stocks changes in value, the index follows it along.
A stock market index can track a group of stocks based on several different factors:
Global: Some indices, such as the MSCI All-Country World Index, aim to be a proxy for all global equities.
Regional Geography: A stock market index can also track a specific region, such as Europe. As an example, the EURO STOXX 50 tracks the performance of the largest and most liquid 50 stocks in the Eurozone.
National: Indices can also serve as a proxy for the performance of an entire country’s equities. The FTSE 100 in the United Kingdom tracks the 100 largest companies traded, which total to 81% of the total market capitalization of the exchange.
Industry: A stock market index can also try to represent an industry as a whole. The GDXJ, for example, is an ETF based on an underlying index that tracks the performance of smallcap mining companies focused on gold and silver.
Exchange: Indices also cover the performance of an exchange as a whole. The S&P/TSX Venture Composite Index, for example, is used to represent the performance of companies that trade on the TSX Venture exchange in Canada.
MAIN INDICES IN THE U.S.
Last year we did a graphical primer of the differences between the main indices and exchanges in the U.S., but we’ll summarize the major indices here as well.


Leave A Comment