At 2.9%, the 10-Year Treasury yield is near its highest level in the past 4 years. At the current rate of inflation (2.2% CPI in the past year), this translates into a real yield of 0.7% (real yield = nominal yield minus inflation).
Is such a real yield good or bad value for Treasury bond investors? And what does it suggest, if anything, for real returns going forward? Let’s take a look at the historical evidence…
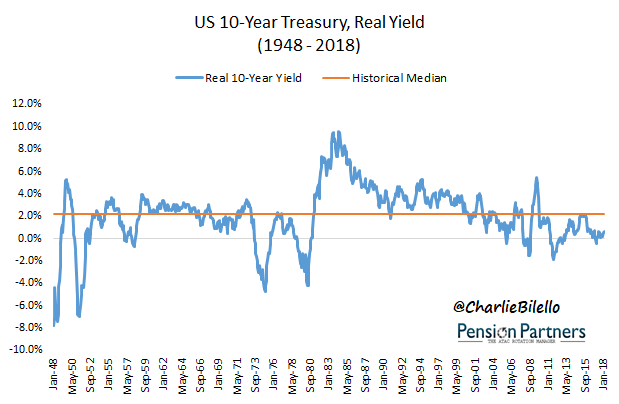
We have monthly inflation data (CPI) in the U.S. going back to 1948. Since then, the median real yield on 10-year Treasury bonds has been 2.2%.

Source Data for all charts herein: FRED
Does that mean we always see real yields around 2.2%? No, far from it.
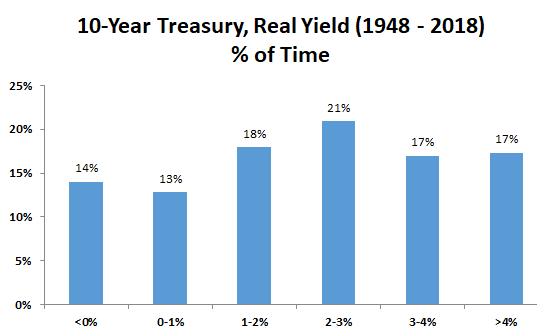
There have been many periods in which real yields have been significantly higher or lower than the historical median. This includes times during which real yields have been negative (14% of the time) and other times when real yield have been above 4% (17% of the time). Today’s real yield of 0.7% is below average, but far from unprecedented.
Following the peak in yields/inflation in the early 1980s, bond yields remained stubbornly high even as inflation cooled. This resulted in a bonanza for bond investors as they earned yields substantially above the inflation rate (5.7% median real yield from 1981-1989) and benefited from a decline in interest rates (15% in 1981 to 7% in 1989). In the 1990s, the good times continued. As inflation cooled even further, bond yields were again slow to react, leading to a 3.6% median real yield from 1991-1999.

Over the past 7 years, we’ve seen much more challenging times for bond investors, with real yields falling to a median level of 0.6%. This is lowest for any 7-year period since the late 1970s/early 1980s when nominal rates had difficulty keeping pace with spiking inflation. We have a very different environment today, with inflation holding steady around 2% while nominal yields have been suppressed by a lack of nominal growth and easy global central bank policies.


Leave A Comment