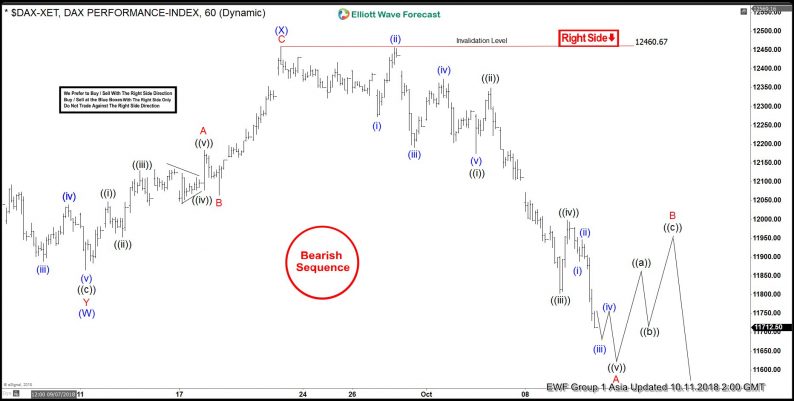
DAX short-term Elliott wave view suggests that the decline to 11865.47 low ended intermediate wave (W). Up from there, the bounce to 12460.67 high ended intermediate wave (X). The internals of that bounce unfolded as a zigzag structure where Minor wave A ended at 12184.41 high in lesser degree 5 waves. A pullback to 12064.41 low ended Minor wave B in 3 swings. While a rally to 12460.67 ended Minor wave C in another 5 waves in lesser degree cycle & also completed intermediate wave (X) bounce.
Down from there, the index has made a new low below the 9/11 low (11865.47) confirming the next extension lower taking place. The initial decline from 12460.67 high is unfolding in 5 waves impulse structure where Minute wave ((i)) ended at 12174.69 low. A bounce to 12348.86 high ended Minute wave ((ii)). Then a decline to 11803.19 low ended Minute wave ((iii)). Minute wave ((iv)) bounce ended at 11998.64 high.
Currently, Minute wave ((v)) remain in progress looking to extend lower 1 more time towards 11594.07-11498.45 0.618-0.764% Fibonacci extension area of a Minute wave ((i)) + ((iii)) to complete Minor wave A of a possible zigzag structure. Afterwards, the index is expected to do a Minor wave B bounce in 3, 7 or 11 swings before further downside is seen. We expect sellers to appear in 3, 7 or 11 swings against 12460.67 high.
DAX 1 Hour Elliott Wave Chart


Leave A Comment